Mean, Median, Mode, Etc
Histograms, Box Plots , Dot Plots
Correlation
Two-Way Tables
100
What does the word "typical" mean you need to find?
Median
100
What is the IQR?

9
100
What is the correlation of the scatterplot below?

Strong Negative Correlation
100
Using the table below. What is the proportion that an adult picks vanilla ice cream.

54/269 = 20 %
200
The data below represents the gpa of 9th graders. What is the median value represent in the context of the problem?
2.5 , 1. 4 , 2.0 , 1.8 , 3.1 , 2.2
The typical 9th graders gpa is 2.1
200
Using the two box plots below, which has a greater median?

2010 Games
200
Using the scatterplot below, describe and estimate the correlation coefficient (r) between the x and y variables.
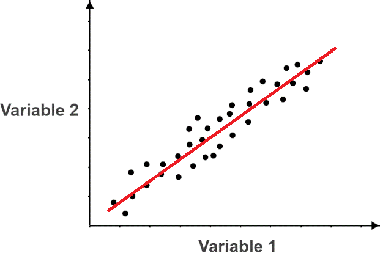
Strong Positive
r = 0.7-0.9
200
Complete the missing value in the table below.

Frozen Apples = 30
Fresh Oranges = 80
Total Oranges = 95
Total Frozen = 105
300
Group 1 - Standard Deviation = 2.4
Group 2 - Standard Deviation = 1.2
Which group has more variation?
Group 1
300
What does the median mean in the context of the problem.

The typical math test score was an 85
300
What is the predicted number of falls on day 8?
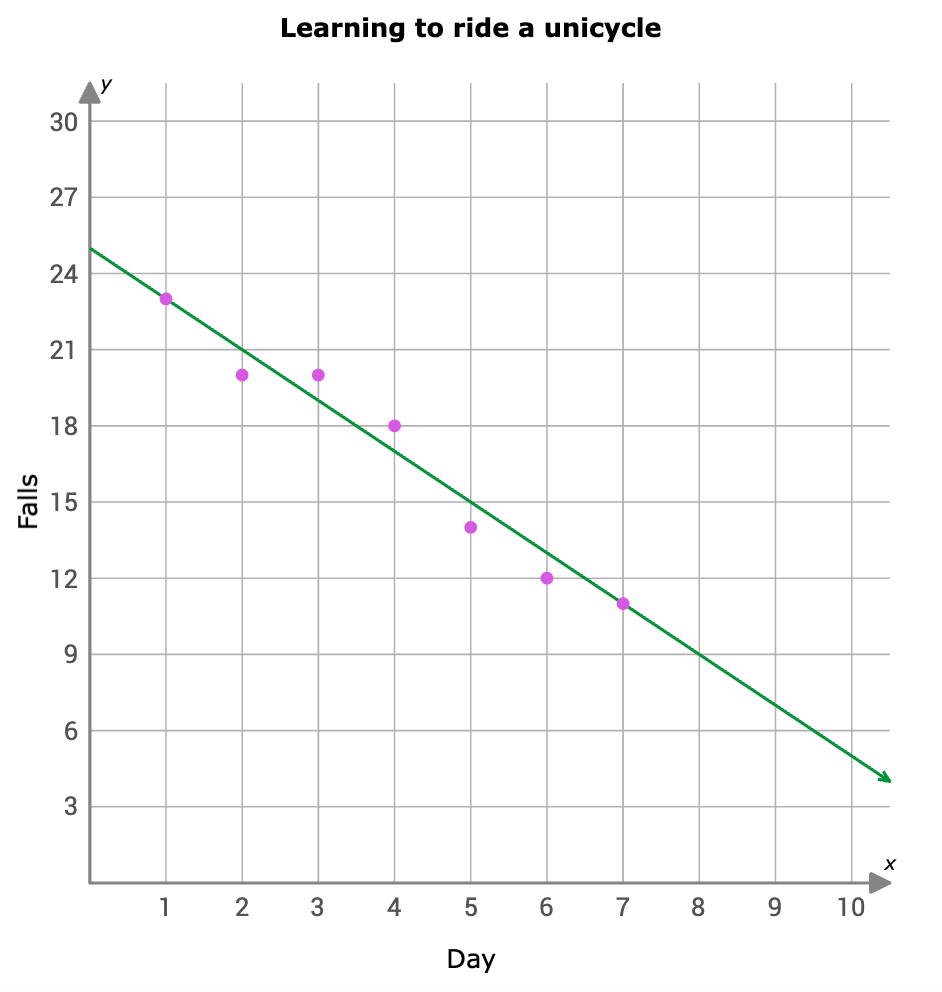
9 falls
300
Using the table below, what is the probability that teen is selected at random, and choose neither ice cream flavors?

45/73 = 61%
400
If we add the number 15 to the following data set, which would be affected more the mean or the median?
22 , 25, 26 , 30 , 32 , 38 , 40
The mean would be affected more.
400
Using the two box plots below, which one has more variance? How do you know?
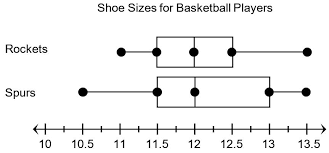
Spurs because the range is bigger
400
Below is the equation that represents the line of best fit between the x, the number of weeks and y, the height (inches) of a plant. What does the slope and y - intercept mean in the context of the problem?
y=3x+7
slope: The plant grows 3 inches per week
yintercept: the plant started at a height of 7 inches
400
Using the table below, given that someone picks chocolate ice cream , what is the probability that they are a child?

40/107 =37%
500
If we add the number 58 to the following data set, which would be affected more the mean or the median? Calculate the new mean and new median.
22 , 25, 26 , 30 , 32 , 38 , 40
The mean would be affected more
Mean = 33.875
Median = 31
500
Using the histogram below, what would happen to the mean if the outlier was removed?

The mean would decrease.
500
Using the equation below that represents the line of best fit, where the number of minutes is x and pounds of blueberries is y. How many pounds of blueberries do you have if 20 minutes have passed?
y= 4x+10
90 pounds
500
Using the table below, what is the probability that an adult is chosen given they choose neither ice cream flavor?
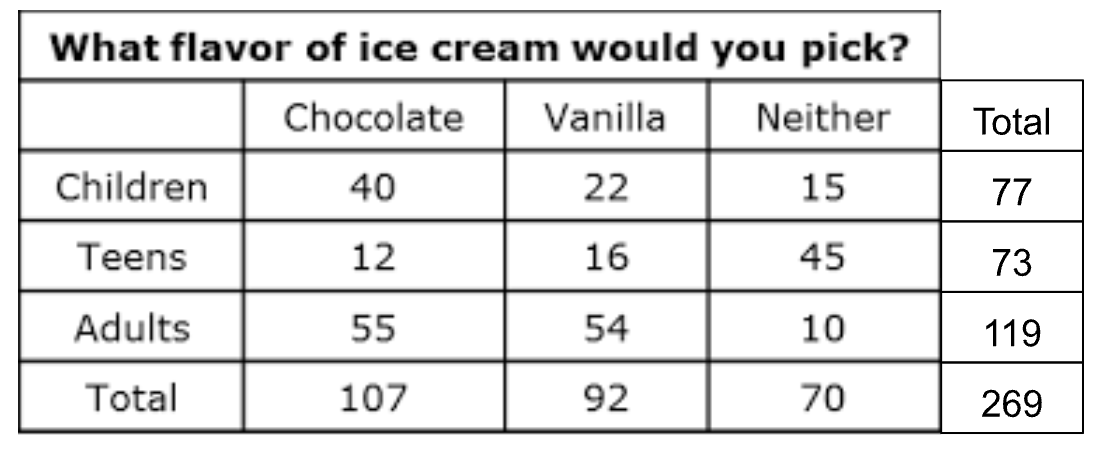
10/70 =14%