Negative, moderate, moderate linear relationship: r is approximately -0.6

What is the sum of the residuals in this LSRL model?
The sum of the residuals on any LSRL is always 0.
The equation of the regression line relating the temperature in degrees Fahrenheit (x) and chirps per minute (y) for the striped ground cricket (x) is
𝑦̂ = −0.31 + 0.212x.
Predict the cricket chirp rate when the temperature is 82 °F (Round to 3 decimal places.)
𝑦̂ = −0.31 + 0.212(82) = 17.074

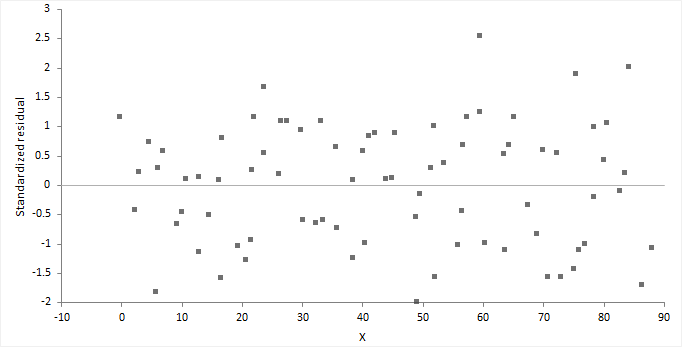
Is a Linear Model appropriate for these data based on this Residual Plot?
Since the Residual Plot shows no pattern, we can determine that a linear model is appropriate for these data.
Which of the following are resistant (not affected) by influential points (select all that apply):
a) Least-Square Regression Line
b) Correlation Coefficient, r
c) Coefficient of Determination, r2
d) none of them are resistant
Influential Points affect the slope and intercept of the regression line. Influential Points, either strengthens or weakens the correlation between the explanatory and the response variable. As a consequence influential points also affect the coefficient of determination, which is the square of the correlation coefficient.
Correct answer is d
A copy machine dealer has data on the number x of copy machines at each of 18 customer locations and the number y of service calls in a month at each location. Summary calculations give x̄ = 2.8, sx = 2.2, ȳ = 2.4, sy = 4.3. Which point is part of the Least Squares Regression Line?
(x̄, ȳ) is ALWAYS part of the LSRL, in this case (2.8, 2.4).
A study found correlation r = 0.89 between the race of a person and the color of their eyes. What is wrong with this correlation coefficient?
The two variables of interest are categorical which cannot be used to calculate r. Only numerical variables can be used.
A study found the coefficient of determination r2 = -0.5 between age (in years) and the number of childhood friends that a person still in contact with. What is wrong with these coefficient of determination?
A coefficient of determination, r2 is a value between 0 and 1.
A LSRL model for the predicted amount of Lucky Charms eaten in accordance with one's age in years is given by the equation below:
ŷ=150.5x-2.34
A 50 year old from our data set is said to have eaten 7,500 lucky charms in his life!
ŷ = 150.5(50) - 2.34
ŷ = 7522.66
Residual is y-ŷ = 7500 - 7522.66= -22.66.


This outlier would have a large residual (far from the linear pattern) which would decrease the correlation coefficient significantly.
A random sample of 30 cars selected from a website for buying used cars produced the following least-squares regression line for predicting the car's mileage from the car's age:
Mileage-hat = 7842.42 + 12085.87(Age)
Interpret the slope of the regression line.
The slope of the regression line is 12,085.87. This means that the predicted number of miles increases by 12,085.87 for each additional 1 year in age
Describe how the point with a student enrollment of 25,500 and 605 property crimes affects the equation of the least-squares regression line (slope and intercept).
Because the point for this college/university has an above-average enrollment and is above the least-squares regression line, it is pulling the line toward itself, making the slope of the line more positive and the y intercept smaller.
A copy machine dealer has data on the number x of copy machines at each of 89 customer locations and the number y of service calls in a month at each location. Summary calculations give x̄ = 4.8, sx = 1.2, ȳ = 12.4, sy = 8.3, and r = 0.68. What is the least square regression line?
Find the slope of the LSRL using the formula b=r(sy/sx)=0.68(8.3/1.2)=4.703
Then find the y-intercept of the least-squares regression line using the formula
a=ȳ−bx̄
a=12.4-4.7033(4.8)
The least-squares regression line is
𝑦̂ = a+bx
𝑦̂ = −10.1758+4.7033x.
Can you predict the total length of a possum from the length of its footprint? In a sample of 104 mountain brushtail possums from Australia, the mean total length is 87.1 cm with a standard deviation of 4.3 cm. The mean foot length is 6.8 cm with a standard deviation of 0.4 cm. The slope of the regression line is 4.784.
Calculate the correlation coefficient, r.
Use the formula for the slope: 𝑏 = r (sy/sx)
4.784 = r (4.3/0.4)
r = 0.445
The correlation between total length and foot length is r=0.445.