Graph Components and Properties
Equations
100
I am the measure of steepness, a hill or a slide. Divide the 'rise' by the 'run' to see how I glide. I am represented by the letter m.
The ratio of the vertical : horizontal change.
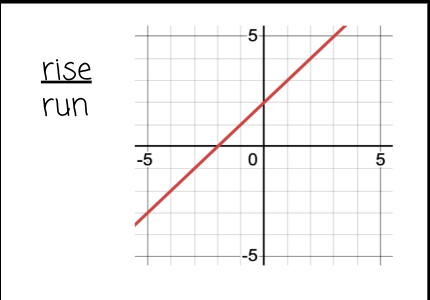
Slope
100
I am the broad family name for almost everything on this list. If you graph me, I will never curve, wiggle, or bend. I go on forever in two directions.
An equation whose graph forms a straight line.
linear equation
200
I am very similar to slope, but I usually tell a real-world story. I compare how one quantity moves in relation to another, like miles per hour or dollars per pound.
The relationship between two quantities that are changing, also called slope.
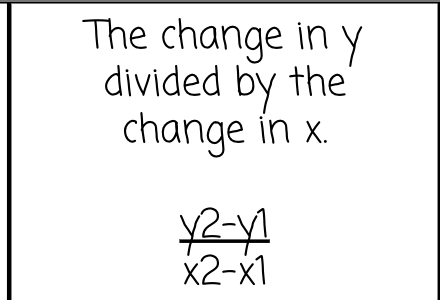
rate of change
200
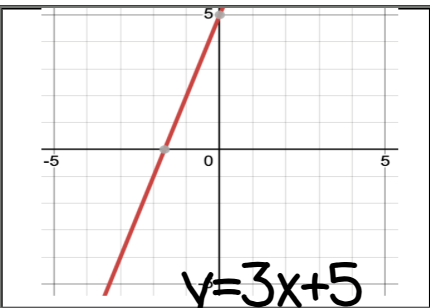
I am the most famous equation, easy to graph and see. Just give me a starting point on the y-axis and a rate of steepness. I am written as y = mx + b.
This form of a linear equation is y=mx+b, where m is the slope of the line and b is the y-intercept.

slope-intercept form
300
I am the point where the graph begins its ride. I live on the vertical axis where $x$ has nowhere to hide. In the equation y = mx + b, I am the b.
The y-coordinate of a point where a graph crosses the y-axis.

y-intercept
300
I am useful when you don’t know where the line crosses the y-axis, but you know a specific coordinate it passes through. I look like this: y - y1 = m(x - x1).
A linear equation of a non-vertical line written as y-y1=m(x-x1). The line passes through the point (x1, y1) with slope m.
point-slope form
400
I am the ground level, the place where the line hits the floor. At my coordinate, the value of y is nothing more than zero.
The x-coordinate of a point where a graph crosses the x-axis.
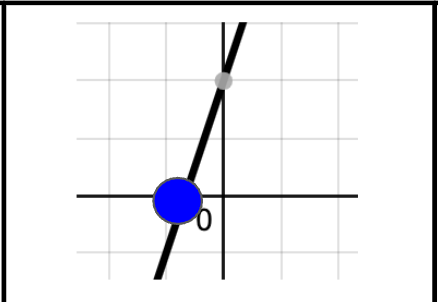
x-intercept
400
I am a bit more formal than the others. I prefer my variables x and y to stand together on the left side, and I don't like fractions. I look like Ax + By = C.
This form of a linear equation is Ax+By=C where A, B, and C are real numbers and A and B are not both zero.

standard form
500
I don't connect the dots exactly; I just show the general vibe. I cut through the middle of scattered data to help you predict the future.
A line on a scatter plot drawn near the points. It shows a correlation.
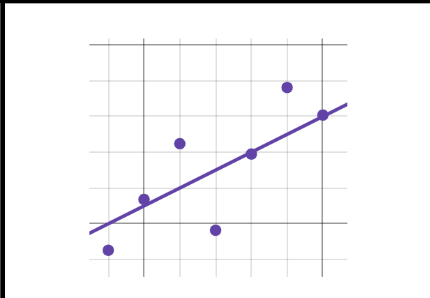
trend line
500
I am a special relationship that always plays fair. If one variable doubles, the other does too. I always pass through the origin (0,0) and look like y = kx.
A linear function defined by an equation of the form y=kx, where k is NOT equal to 0.

direct variation
600
I have a split personality. For one part of the graph, I follow one rule, but for another part, I switch to a completely different equation.
This function has different rules for different parts of its domain.
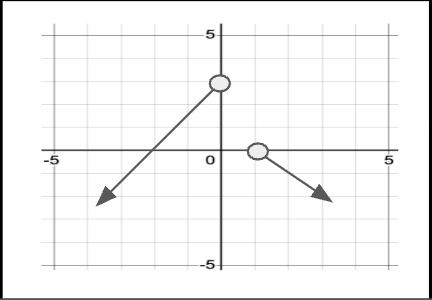
piecewise function
700
I am a specific type of piecewise function that looks like a staircase. I stay flat for a while, then jump instantly to a new height.
This function pairs every number in an interval with a single value. The graph can look like the steps of a stair case.
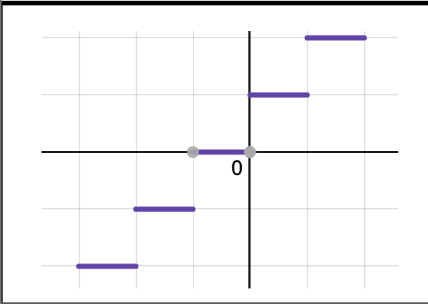
step function