Measures of Variability
Measures of Center
Dot Plot
Histogram
Vocabulary
100
What is the range of this data?
25, 37, 39, 85, 85
85 - 25 = 60
100
What is the mean of this data set?
10, 12, 14, 18, 20, 22
10 + 12 + 14 + 18 + 20 + 22 = 96
96 divided by 6 = 16
100
What is the range of this data?
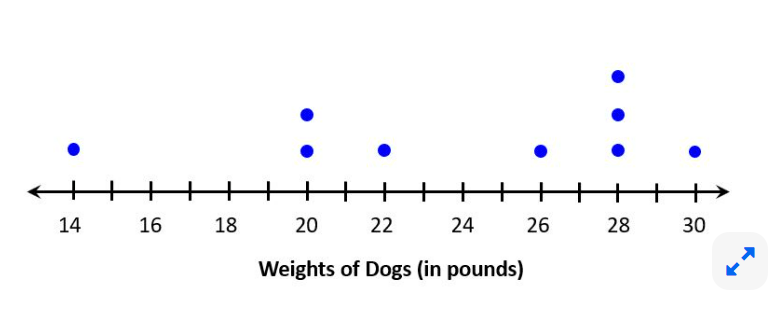
30 - 14 = 16 lbs
100
How many teens texted 20 or fewer times per day?
8 teens
100
What is the mean and how is it found?
The average of a data set.
It can be found by adding all the values together and dividing by how many values are in the set.
200
True or false: The outlier is the mode.
True!
200
What is the median of this data set?
25, 37, 39, 85, 85
39
200
What is the mode?

28 lbs
200
How many teens texted more than 40 times per day?
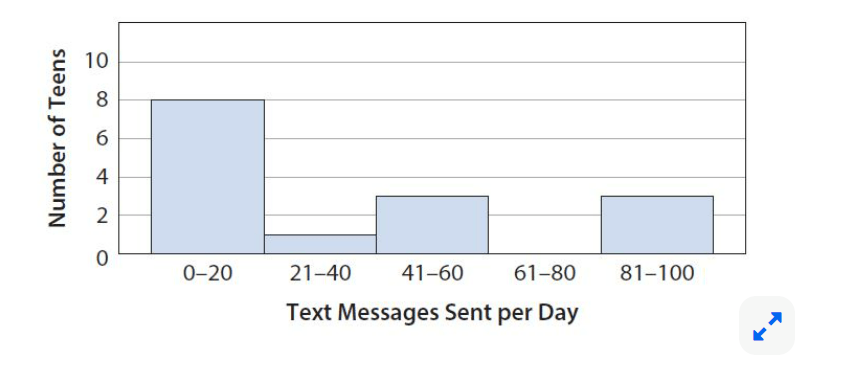
6 teens
200
What is the mode?
The value that appears the most in the data set.
300
Find the mean of this data set.
25, 35, 40, 85, 85
25 + 35 + 40 + 85 + 85 = 270
270 divided by 5 = 54
300
What is the mode of this data set?
25, 37, 39, 85, 85
85
300
What is the median dog weight?
26 lbs
300
How many teens participated in this survey?

15 teens participated
300
What is the Interquartile Range (IQR) of this data?

50 - 10 = 40
400
What is the mode of this data set?
3, 3, 4, 7, 8, 9, 9, 9, 9, 9, 9, 11
9
400
What is the median of this data set?
19, 23, 27, 35, 60
27