Scatter Plot Vocab
Slope Intercept Form
Multi-Step Equations (Review)
Slope
Random
100
A data point that is by itself and away from all other data points.
Outlier
100
What is the slope y= 4x + 3
m = 4
100
8b + 3b = 22
What is b?
b = 2
100
Find the slope of the line of this graph: 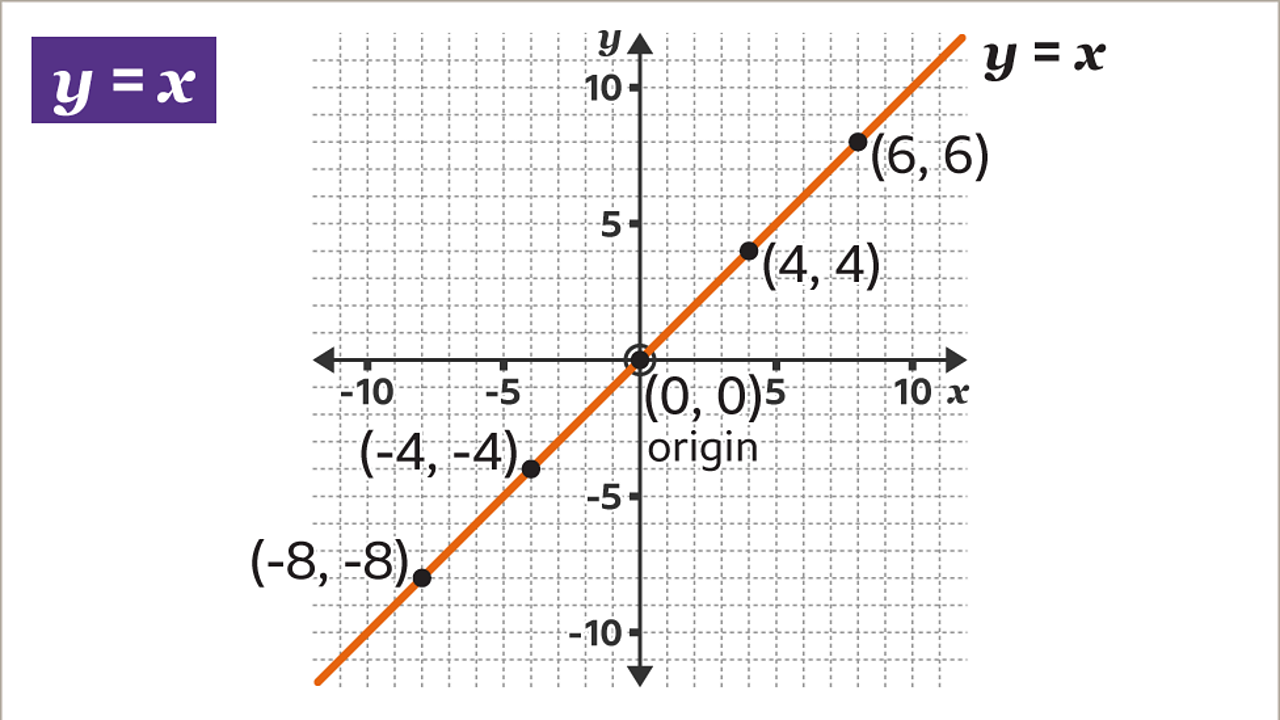
What is slope = 1?
100
What is one benefit of representing data using a scatter plot?
-It shows general trends.
-It can make predictions.
200
A Group Of Scatter Plots
Cluster
200
What is the y-intercept of the line: y= -2x
b = 0
200
Solve for x.
8x - 5x + 5 = 10
x = 5/3
200
Find the slope of this graph: 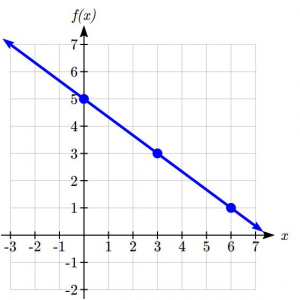
What is slope = -2/3?
200
Draw a scatter plot with a positive, linear association.
(Draw a group of ordered pairs that go in a positive direction- linear tendency.)
300
A line that is used to predict the data from a scatter plot.
Trend Line or Line of Best Fit
300
This is the y-intercept y=3x-4?
b = -4
300
Find the value of a.
a = a
infinitely many solutions
300
Find the slope between these two points:
(4, 5) and (-2, 3)
What is slope = 2/6 or 1/3
300
How is a relative frequency table different than a two-way frequency table?
Relative frequency tables show percentages.
400
All of the data in a scatter plots trends upwards.
Positive Correlation
400
This is the slope of a horizontal line.
zero
400
Solving Equations
14 = (3a + 6) + 2
a = 2
400
Find the slope between these two points:
(-4 , -2) and (-8, -10)
Slope = 2
400
What is the date that Unit 6 closes?
Tuesday, June 2.
500
When all of the data trends downwards in a scatter plot.
Negative Correlation/ Negative Association
500
What is the equation of the line that crosses through the points (0,0) and (0,8)?
x = 0
500
9(y - 4) - 7y = 5(3y - 2)
What is y?
y = -2
500
Write the equation of the line that passes through the points (3,9) and (4,10).
y = 1x + 6
500
Write the equation of the line that passes through the points (1,0) and (2, -4). Show all your work.
y = -4x + 4