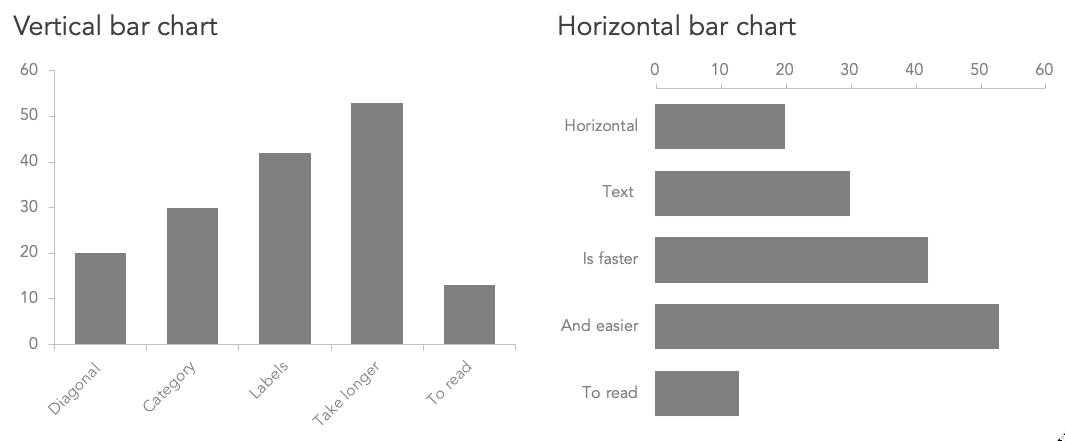
Bar Graphs
Area
Venn diagrams
Line Plots
100
True or false: Bar graphs can be vertical and horizontal.
True
100
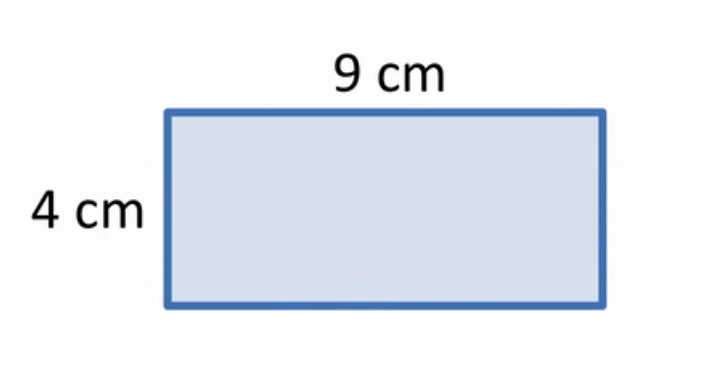
How do you find area of a rectangle?
Area = Length x Width
100
Where do you find the number of students who participate in BOTH activities on a Venn diagram?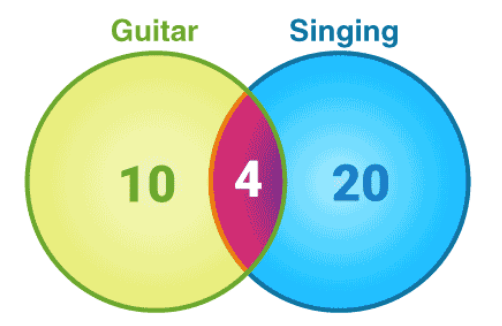
In the MIDDLE
100
This graph uses X to represent _______.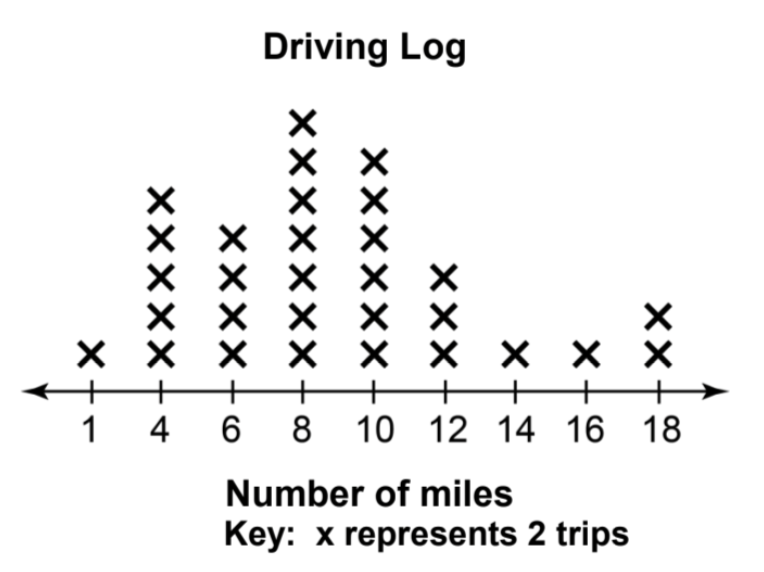
2 trips
200

What month did it rain the most?
May
200
What is the area?
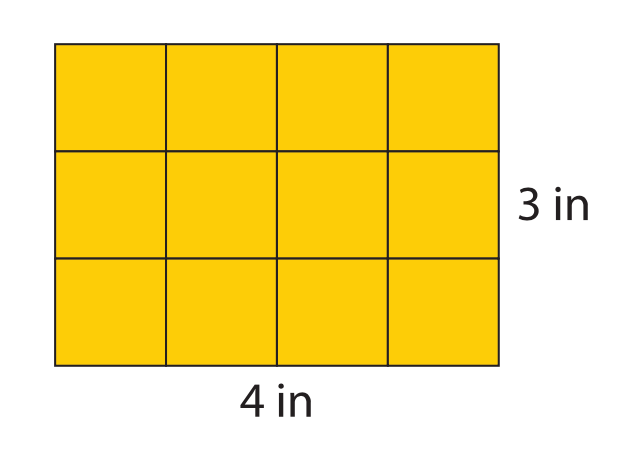
12
200
How many students play both hockey and gymnastics?
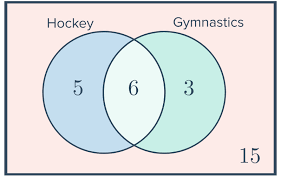
6
200
How many classrooms have exactly 31 students?
1
300

What months have the same amount of students?
November and February
300
What is the area?
36
300
 How many numbers were both odd and greater than 10?
5
300
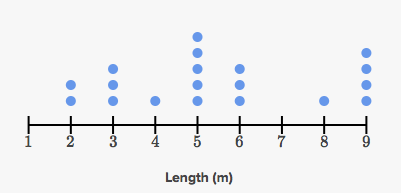
How many trees were 6 meters or taller?
8
400
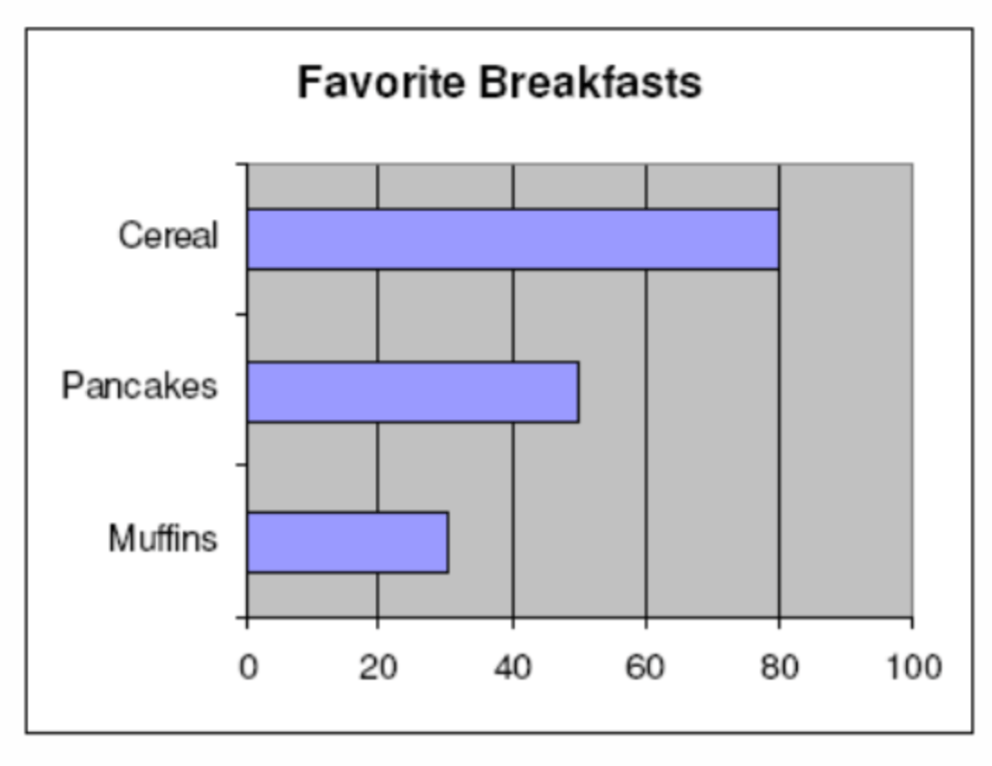
How many students preferred pancakes and muffins as their favorite breakfast?
80 students
400
What is the area of the shape?
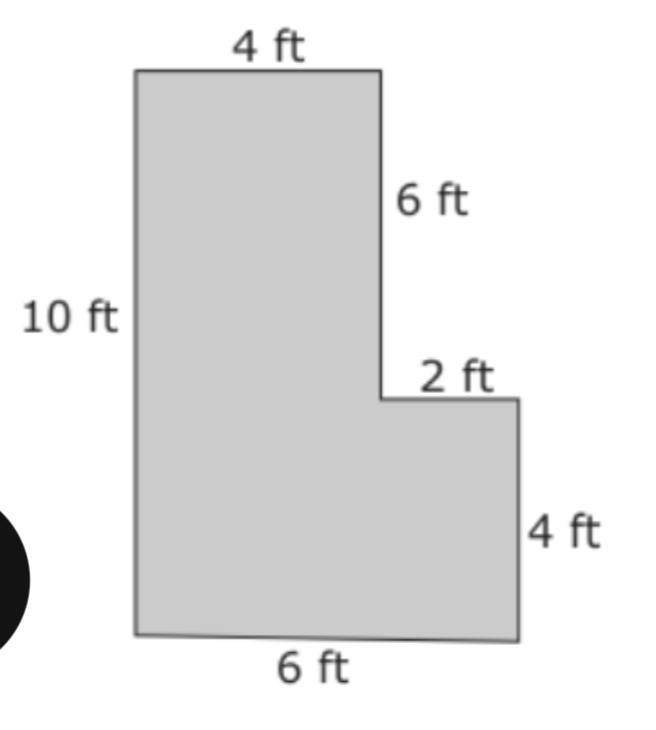
48
400
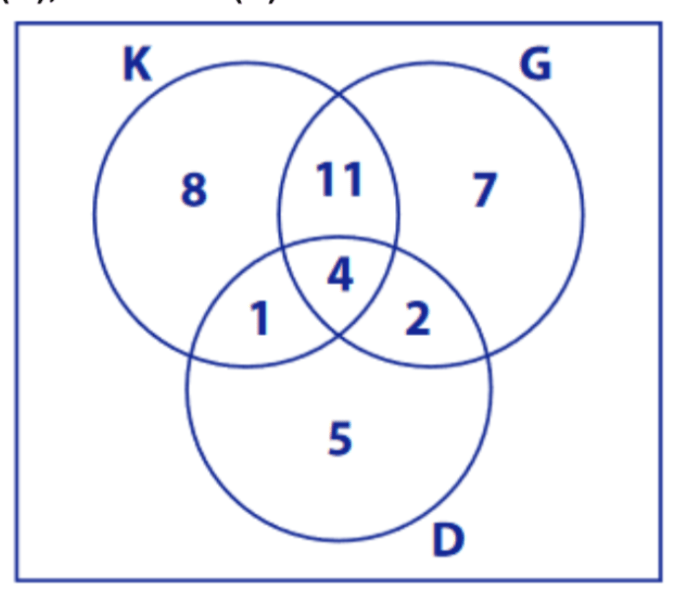
How many students joined only the math club?
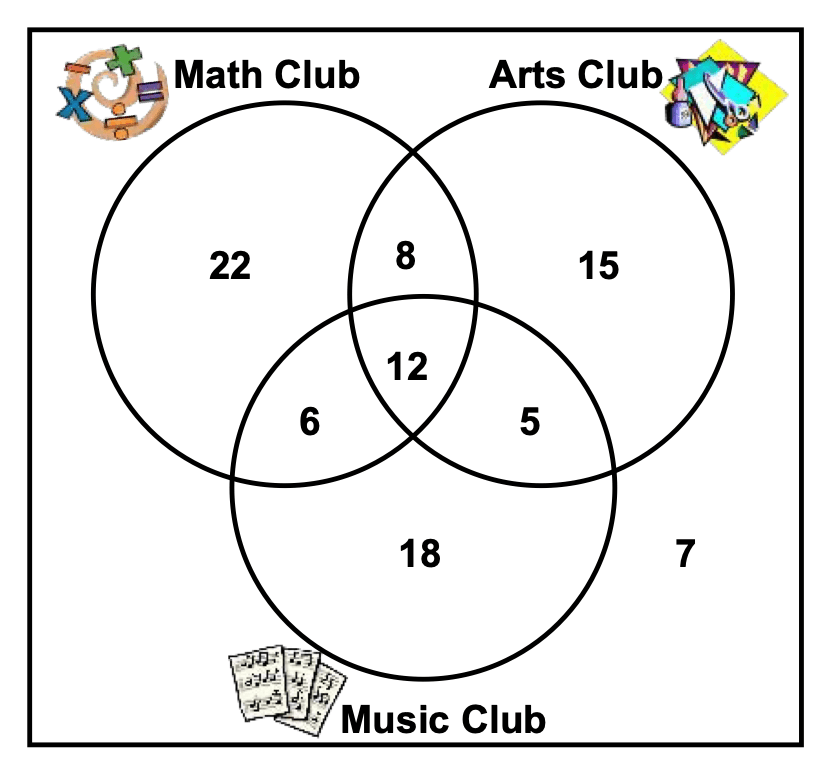
22
400
Make a line plot to show the weights of the pumpkins.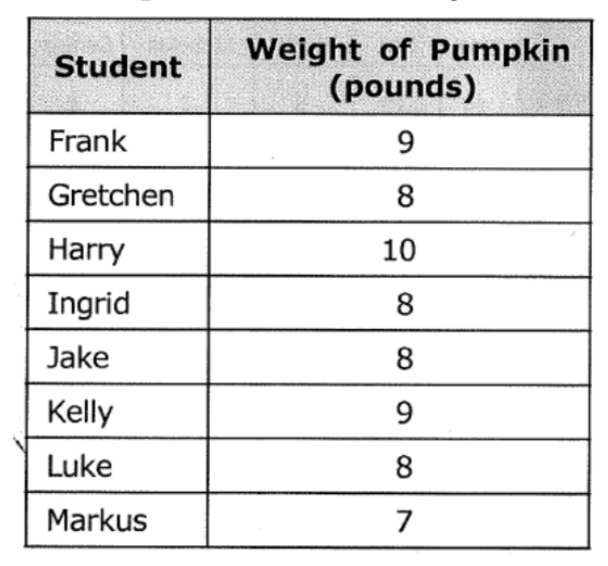
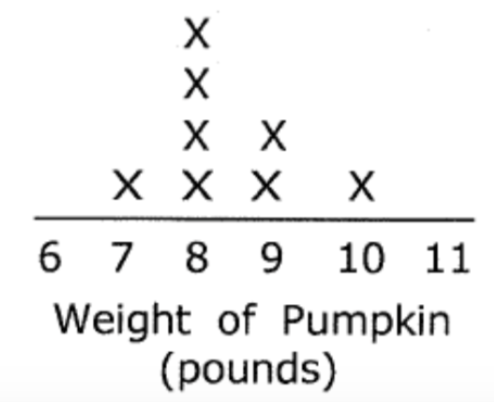
500

What question could you answer using the bar graph above?
a. How much more time was spent reading than horseback riding?
b. How much more time was spent playing piano than painting?
c. How much total time was spent horseback riding, painting and playing piano?
d. How much time was spent babysitting?
b. How much more time was spent playing piano than painting?
500
What is the area of the shape?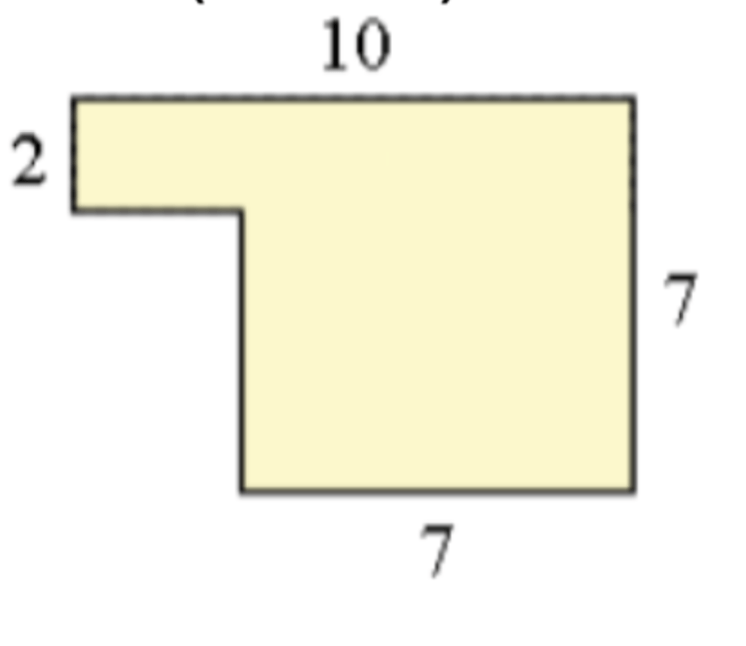
55
500
Which frequency chart to show the same data?
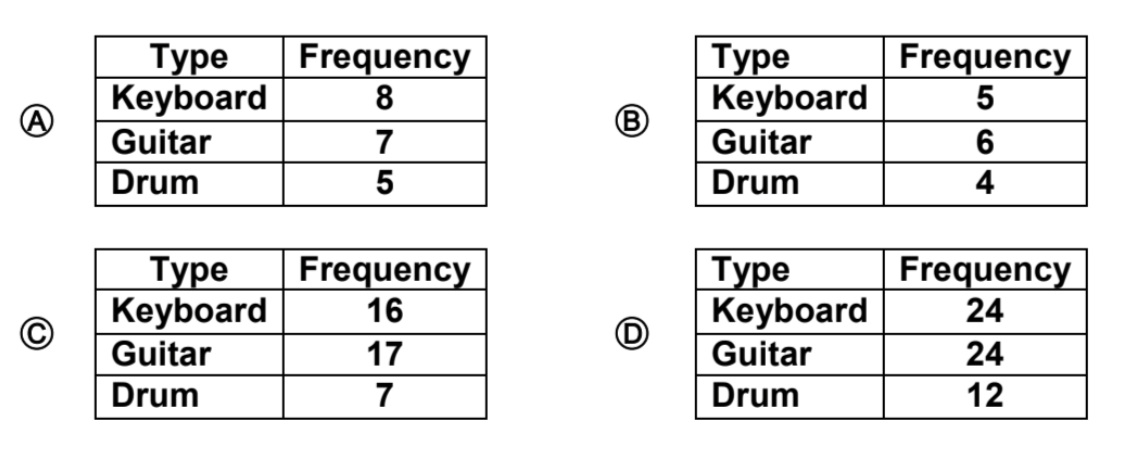

500
Mr. Brown kept a driving log for the miles he drove for his job. What is the total number of times he drove for 8 miles?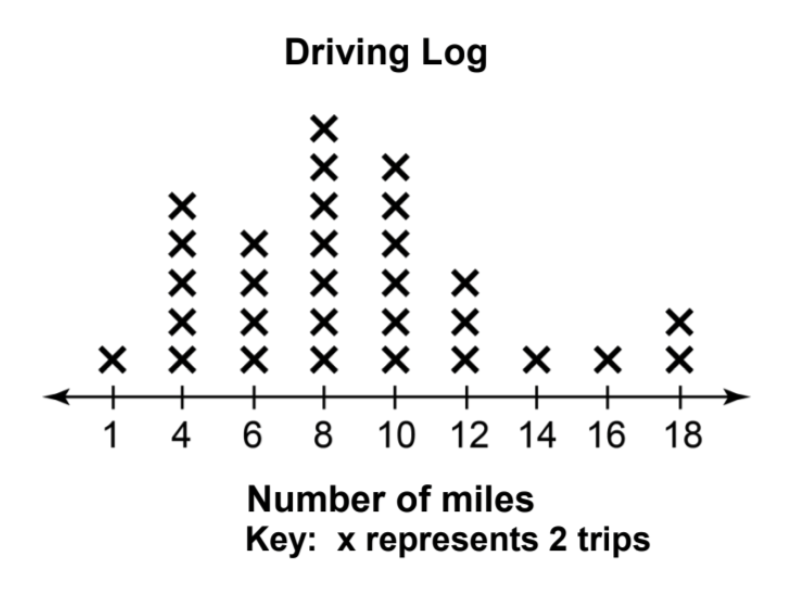
14 trips