Graphs
Acceleration
Vocabulary
More graphs
Other math
100
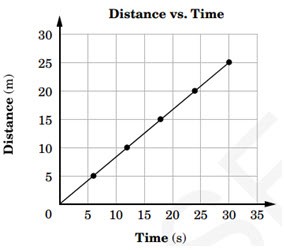
The graph represents the motion of a cart. How does the speed of the cart compare when t=6s and t=12s?
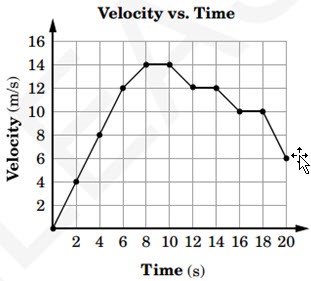
The speed of the cart is 2m/s at 6s and 12 s
100
An athlete running 2.6 m/s increases his velocity to 3.7 m/s in 2.7s. What is the acceleration of the runner?
0.41 m/s2
100
Describe the difference between speed and velocity.
Velocity includes distance and direction while speed only includes distance
100
Which graph represents a car sitting still?
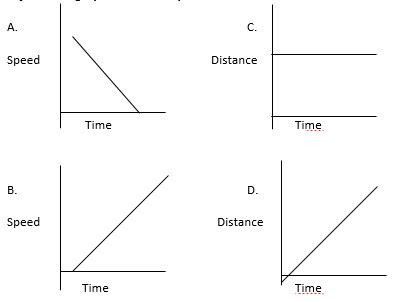
C
100
A truck travels 50 m/s in a 30-second time frame. What is the distance traveled?
1500 m
200
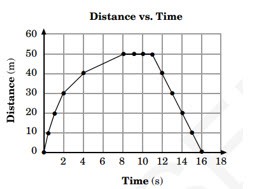
The graph shows the distance traveled by an object over 100 seconds. What happened to the motion of the object between t=50s and t=70s?
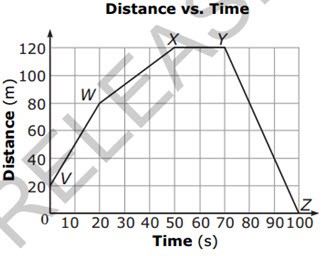
The object stopped moving
200
A car traveling at 6.1 m/s increases it's speed to 36.5 m/s in 9.9s. What assumption can be made about the acceleration of the car?
The average acceleration is 3.1m/s/s
200
What is free fall?
The movement of an object toward the earth solely due to gravity
200
Which graph represents a car with a positive acceleration?

B
200
If Bob walks 2 blocks east, 4 blocks south, and 2 blocks west, what distance has he traveled?
What was his displacement?
Distance: 8 blocks
Displacement: 4 blocks south
300
This graph represents the velocity of an object over time. What is the average acceleration of the object during the first 4 seconds?
2 m/s2
300
What is the correct equation for calculating acceleration?
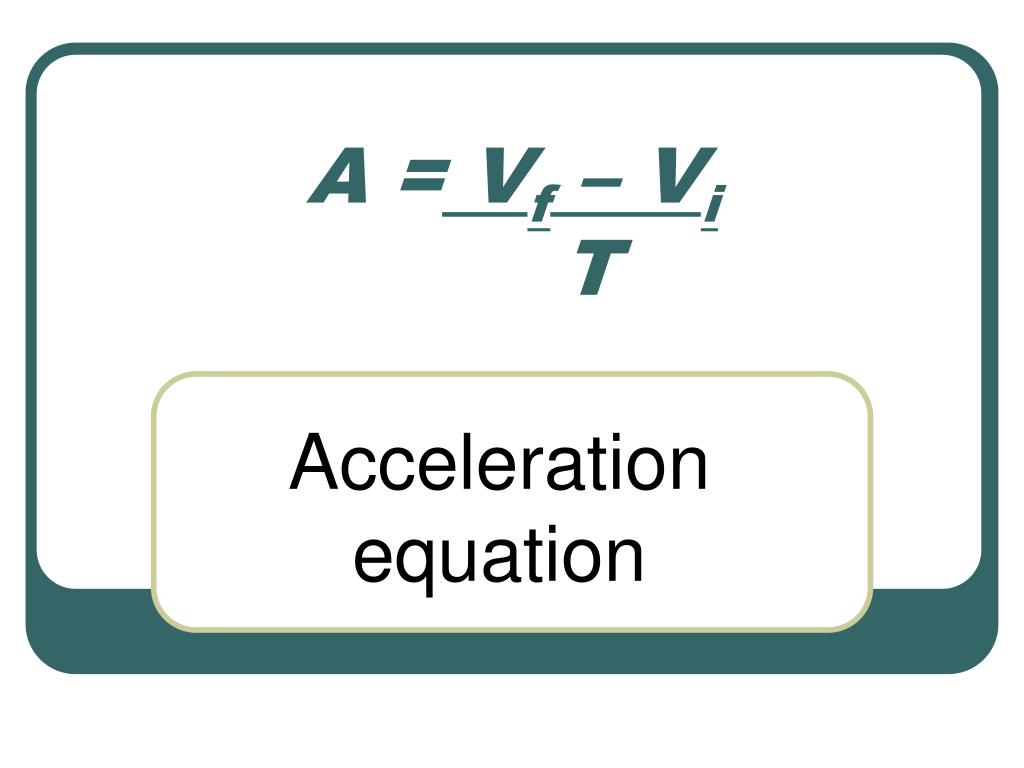
300
Motion is defined as _______________________________...
A change in position or place
300
Which graph represents a moving object with a constant speed throughout its entire travel time?
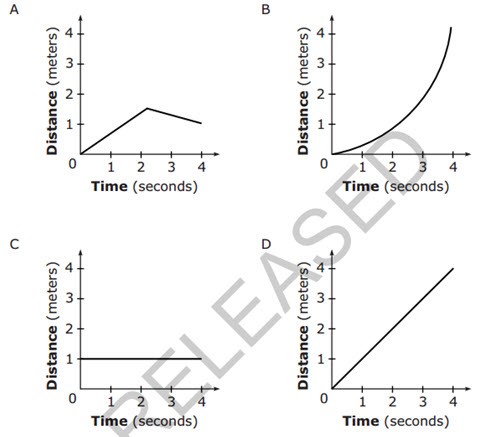
D
300
The average speed of a cart during a 15s interval is 3m/s. What is the total distance travelled by the cart?
45 m
400
A car is traveling at a constant speed of 12 m/s. When the driver accelerates, the car reaches a speed of 26 m/s in 6 s. What is the average acceleration of the car?
2.3 m/s2
400
You are riding a motorcycle at a speed of 140 m/s then breaks hard to avoid an accident and come to a stop. If your acceleration is -52 m/s2, then how long did it take you to stop?
2.7 s
400
The Frame of Reference is defined as _________________________...
A system of objects that are, or are not moving in relation to one another.
400
Which graph represents an object that is decreasing speed?
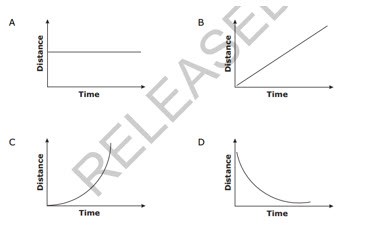
D
400
The graph represents the motion of a cart. What is the average speed of the cart?
0.83 m/s
500
The graph shows the acceleration of a car over time. If the car starts from rest, what is the velocity of the car after 5 seconds?
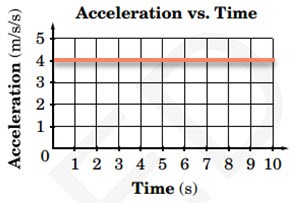
20 m/s
500
The chart below represents the change in velocity for four different trains. If it took 5.38s to reach the final velocity, which train had the greatest acceleration?
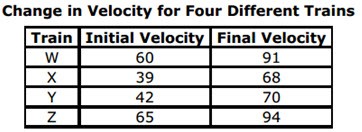
W
500
What is a vector?
A quantity that has both magnitude and direction
500
For the entire trip beginning from rest to 20 seconds, what was the biker’s acceleration for the journey?
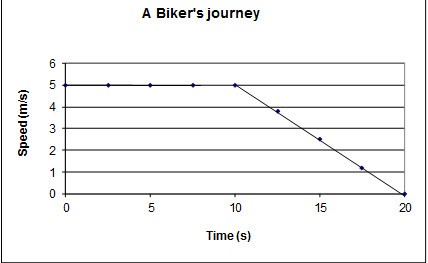
- 0.25 m/s2
500
What is the average speed of a bobsled that travels 115 m in 25 s?
4.6 m/s