Name That Graph
Data Measures
Frequency Tables & Histograms
Box & Whisker Plots
Which would you use?
100
What is the name of the following graph?
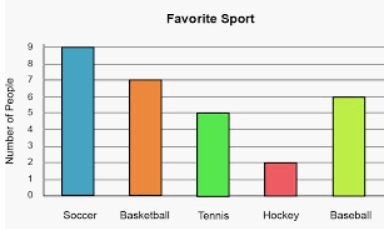
Bar Graph.
100
The data value that occurs most often is called...
mode
100
What is one difference between bar graphs and histograms?
Bar graphs have spaces between the bars, Histograms do not. Histograms have intervals. Bar Graphs tell you about specific data.
100
What does the number on the far left whisker represent>
the data point with the lowest value
100
What do you have to do in order to improve in math?
Study
200
What is the name of the following graph?
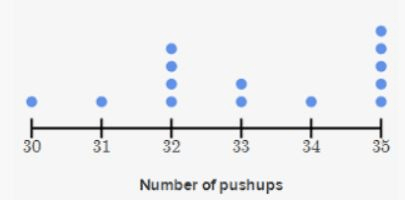
Dot Plot.
200
The difference between the least and the greatest data value is...
range
200
For a histogram, the frequency is always on which axis?
The y-axis.
200
What data point on a box and whisker plot marks quartile #2?
The median
200
To track my disc golf scores, I want to see my frequency for each interval. Which data presentation has intervals of numbers on the x axis?
Histogram
300
Name the following graph:
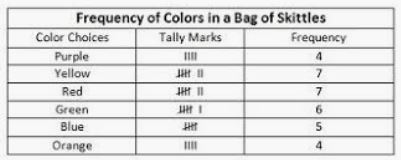
Frequency Table.
300
The data value exactly in the middle of an ordered set is the ...
median
300
What goes on the x-axis for a histogram?
The intervals of numbers .
300
What percent of the data is contained between the two boxes (the interquartile range)?
50%
300
I want to compare favorite bands among my classmates
bar graph
400
Name the following graph and find the range of the set of data.
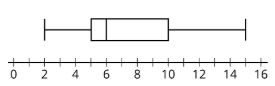
Box and Whisker Plot. The range is 13.
400
13, 16, 18, 19, 23, 24, 24, 25, 27
Find the mean.
21
400
What is true about the intervals used for a histogram?
They must be equal. They cannot overlap. Each number can only belong inside one interval.
400
What measure of center is a box and whisker plot best for showing? (mean, median, or mode)
The median.
400
I'm tracking the heights of 9th graders across the country, and I want it organized in percentile groups. This is used numerical data displayed in groups.
box and whisker plot
500
This graph has bars that touch, frequency on the y-axis, and intervals on the x-axis. What is the name of this graph?
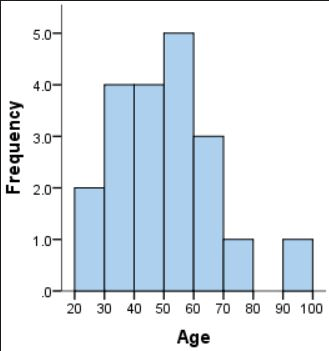
A histogram.
500
13, 16, 18, 19, 23, 24, 24, 25, 27
Find the quartile 1 number.
17
500
True or False: a histogram tells you specific information about the data.
False.
500
What are the five important pieces of information you must find in order to create a box and whisker plot?
The median. Quartile 2
Quartile 1
Quartile 3
Smallest #
Largest #
500
Where does Ms. Allen go to college?
Central! Fire Up Chips!