Mean, Median, Mode and Range
MAD
Best Measure of Center and Variability
IQR
Box Plots, Histograms and Dot Plots
100
What is the mode?
1, 2, 2, 4, 4, 1, 1, 2, 2
The mode is 2
100
In the data set below, what is the mean absolute deviation?
6, 8, 4, 3, 8
If the answer is a decimal, round it to the nearest tenth.
1.8
100
The number of books students in a reading club read last month are:
3, 3, 3, 4, 4, 5, 50
Which measure of center best represents this data set?
a) Mean
b) Median
c) Mode
d) Range
B - Median
100
In the data set below, what is quartile 3/The upper quartile?
1 4 4 6 8 9
8
100
During Fitness Day at school, Tristan and his classmates took part in a pull-up competition, keeping track of the results. Which range of pull ups has the highest number of people?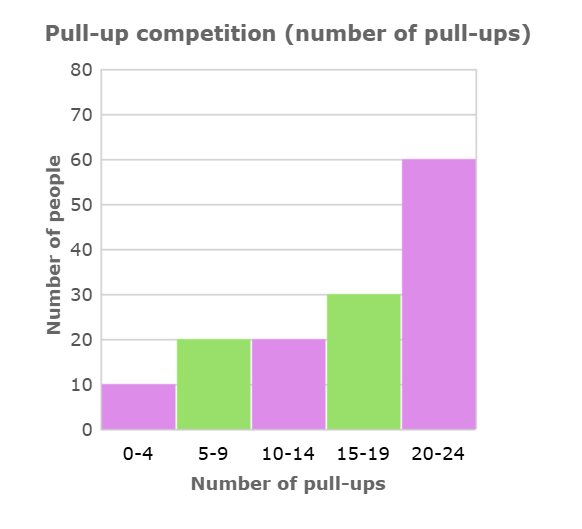
20-24
200
Matt worked at the ice cream parlor over the summer. On his last 8 shifts, he scooped:
9 scoops
7 scoops
9 scoops
7 scoops
8 scoops
7 scoops
5 scoops
9 scoops
What was the range of the numbers of scoops?
The Range is 4 scoops
200
In the data set below, what is the mean absolute deviation?
5, 2, 5, 5, 9
If the answer is a decimal, round it to the nearest tenth.
1.5
200
Here are the number of text messages 10 students sent in one day:
45, 50, 48, 47, 46, 49, 52, 48, 46, 47
Which measure of center and variability best describe this data set? Explain your reasoning.
Best measure of center: Mean (since the data is fairly symmetrical and there are no outliers).
Best measure of variability: mean absolute deviation
The data values are close together with no extreme values.
200
In the data set below, what is the lower quartile/ quartile 1?
1 1 3 5 7 8 8
1
200
This morning, Mr. Baldwin released the scores from last week's spelling test. How many students scored between 80 and 119 points? 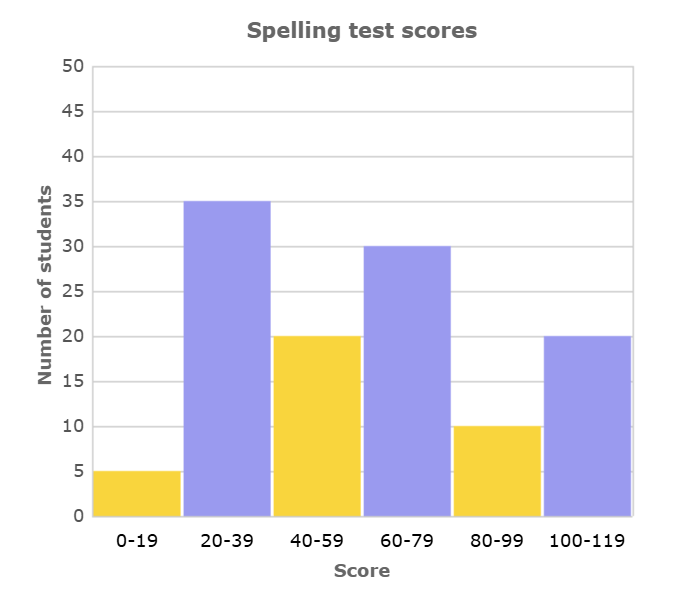
30 Students
300
Ethan's class sold chocolate bars as a fundraiser for a field trip. The 8 students sold:
4 chocolate bars, 4 chocolate bars, 4 chocolate bars, 4 chocolate bars, 4 chocolate bars, 3 chocolate bars, 2 chocolate bars, 7 chocolate bars
What was the mean number of chocolate bars sold?
The mean number is 4
300
In the data set below, what is the mean absolute deviation?
13, 38, 44, 82, 50, 34
If the answer is a decimal, round it to the nearest tenth.
15.2
300
The following are the number of goals scored by a soccer team in 8 games:
0, 2, 2, 3, 3, 3, 4, 10
a) What is the best measure of center for this data set? Calculate it.
b) What is a good measure of variability? Calculate it.
IQR: 1.5
Median: 3
a) Best measure of center: Median = (3 + 3) ÷ 2 = 3
b) Step 1: Order the data (already done): 0, 2, 2, 3, 3, 3, 4, 10
Step 2: Find Q1 and Q3
Lower half: 0, 2, 2, 3 → Q1 = (2 + 2) ÷ 2 = 2
Upper half: 3, 3, 4, 10 → Q3 = (3 + 4) ÷ 2 = 3.5
IQR = Q3 - Q1 = 3.5 - 2 = 1.5
300
In the data set below, what is the upper quartile/quartile 3?
41
60
67
72
82
77
300
Select all the statements that describe the distribution of the data.
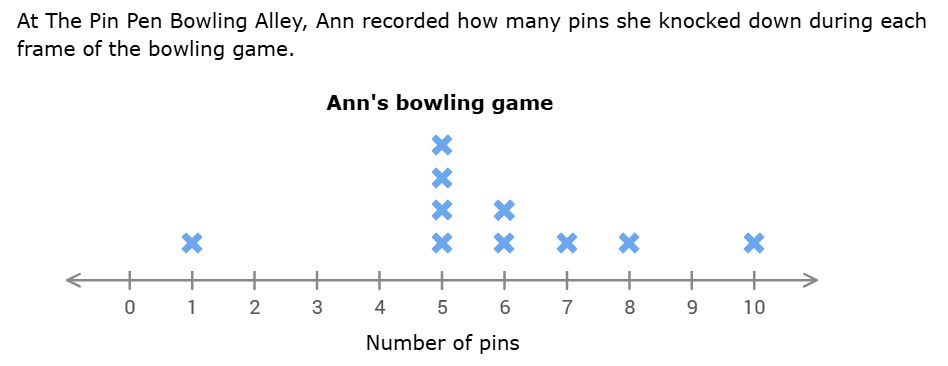
a. The data is roughly symmetric
b. There is a gap from 2-4 pins
c. There is an outlier at 8 pins
b. There is a gap from 2-4 pins
400
What is the mean?
1, 8, 1, 0, 8, 7, 0, 1, 1
The mean is 3
400
Victoria worked at the ice cream parlor over the summer. On her last 7 shifts, she scooped:
70 scoops, 48 scoops, 60 scoops, 22 scoops, 91 scoops, 41 scoops, 88 scoops
What was the mean absolute deviation of the numbers of scoops?
If the answer is a decimal, round it to the nearest tenth.
19.7
400
A group of students recorded how many minutes they spent on homework each night for a week:
45, 50, 52, 47, 49, 46, 90
Which measure of center best represents the data?
Which measure of variability best represents the data?
Median = 49
IQR = 6
400
In the data set below, what are the lower quartile, the median, and the upper quartile?
1 1 1 1 5 3 6 3
Q1 =
median =
Q3 =
lower quartile = 1
median = 2
upper quartile = 4
400
Complete the sentences.
The median of the data is __________ runs. It describes the _______of the distribution.
a. 3 ... center
b. 3 ... spread
c. 4 ... center
d. 4 ... spread
Submit
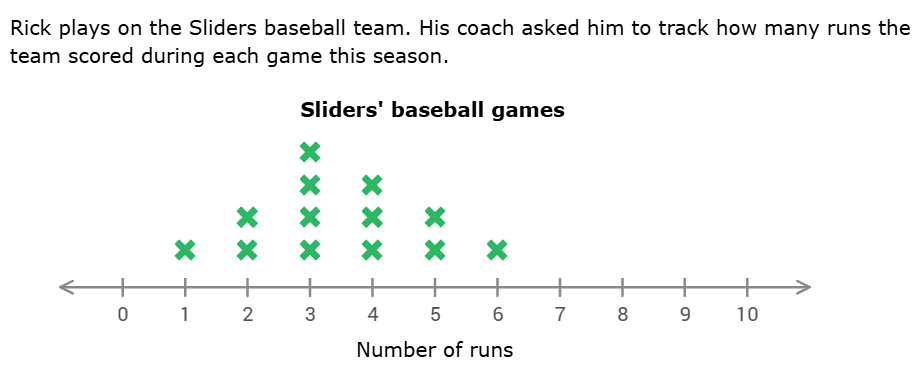
a. 3 ... center
500
Riley's school sold raffle tickets to raise money for new athletic equipment. By the end, 5 students sold:
8 tickets
9 tickets
7 tickets
6 tickets
7 tickets
What was the median number of raffle tickets sold?
The median number of raffle tickets sold is 7
500
The owner of a candle store studied the day's purchases. The 5 candles purchased had prices of:
$9.00
$3.00
$6.00
$5.00
$7.00
What was the mean absolute deviation of the amounts spent? If the answer is a decimal, round it to the nearest ten cents.
$1.60
500
The number of pages 6 students read in their independent reading books is:
42, 45, 47, 46, 44, 46
Which measure of center best represents the data?
Which measure of variability best represents the data?
Mean = 45
MAD ≈ 1.33
500
In the data set below, what are the lower quartile, the median, and the upper quartile?
7 3 2 3 4 2 9 9 2 7 1
lower quartile =
median =
upper quartile =
lower quartile = 2
median = 3
upper quartile = 7
500
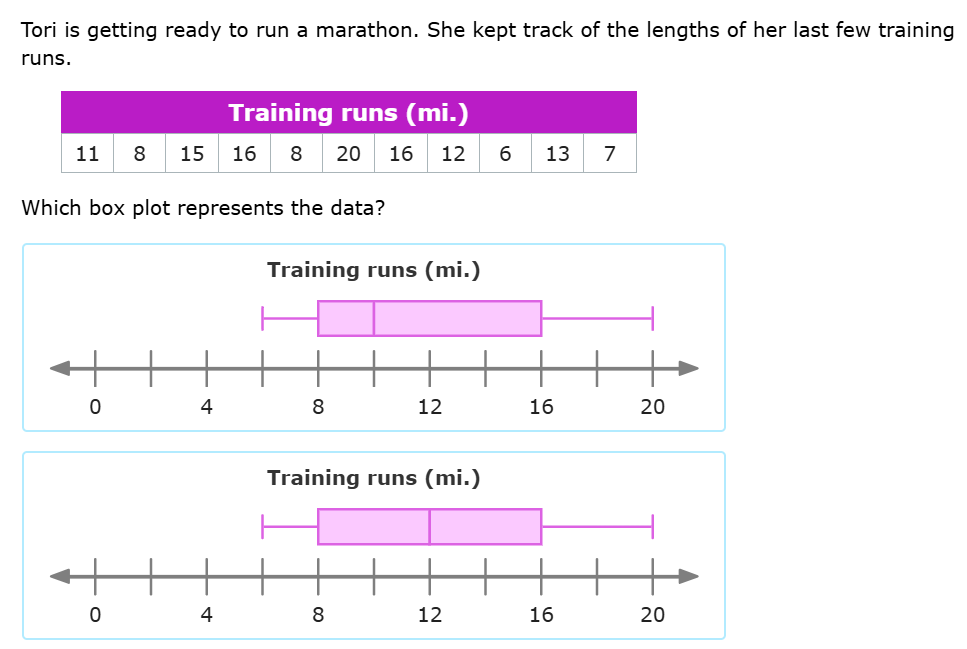
The bottom box plot