Mean
Median
Mode & MAD
Histograms & Dot Plots
Quartiles, IQR, & Range
100
What is the mean of: 2,2,2,5,5,5,8,8,8
5
100
What is the median of:
1,2,3,4,5,6,7,8,9,10,11
6
100
Find the MAD:2,4,6,6,8,10
2
100
Create a Dot Plot of the data: 1,5,3,4,2,5,2,3,5,1,6,2,5,3
.
. . .
. . . .
. . . . . .
|-----|-----|-----|-----|-----|
1 2 3 4 5 6
100
What is the IQR of: 6,2,7,4,5,1,3
4
200
What is the mean of: 2,2,1,1,2,6,0,1,0,1,2,0
1.5
200
What is the median of:
3,5,7,9,11,3,8
7
200
Find the MAD: 1,2,3,4,4,4,4,5,6,7
1.2
200
Create a dot plot of: 5,9,10,5,8,8,5,9,10,10,7,7,8,6,9,10,5
. .
. . . .
. . . . .
. . . . . .
|-----|-----|-----|-----|-----|
5 6 7 8 9 10
200
What is the 3rd Quartile of: 65,96,89,91,94,89,67
94
300
What is the mean of: 2,1,2,4,2,3,3,2,5,2,1,3
2.5
300
What is the median of:
14,19,16,13,16,14
15
300
What is the mode of: 234,666,124,987,456,666,532
666
300
Below are numbers of pets that students have. Use the data to create a histogram:
Numbers of Pets : Frequency
1-5 : 4
6-10 : 3
11-15 : 6
16-20 : 2
See Board
300
What is the IQR of: 45,78,89,12,67,56,23,90,34
55
400
What is the mean of:
Ages in class: 11,12,12,12,12,12,13
12
400
What is the median of: 44,13,40,52,27,31
35.5
400
What is the mode: 12345,87654,8765,234,7654,234,8765
234 & 8765
400
.
. .
. . . . .
. . . . . .
|-----|-----|-----|-----|-----|
6 9 12 14 17 19
Find the Mean, Median, Mode, Range, and IQR of the Dot Plot
Mean: 14.07 or 14 1/14
Median: 14
Mode: 19
Range: 13
IQR: 19-12 = 7
400
What is the Range, Q1, & Q3 of: 666,64,49,981,55,678,50
Range: 932
Q1: 50
Q3: 678
500
What is the mean of: 1,1,2,3,3,6,8,9,12,15
6
500
What is the median of:
17.2,12.4,13.5,13.4,13.87,12.47
13.45
500
Find the Mode & MAD: 18,23,25,28,31,31
Mode: 31
MAD: 4
500
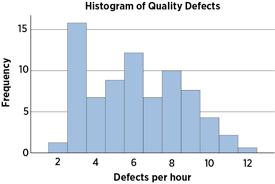
Based on the Histogram... Which number of defects per Hour are approximately the same, and what is their frequency?
4 Defects per hour
7 Defects per hour
Frequency: 7
500
What is the Range and IQR of: 2.34,3.41,5.32,6.45,8.43,9.086,11.9
Range: 9.56
IQR: 5.676