Central Tendencies/ Box and Whisker Plots
Probability
Polynomials
GCF & LCM/Simplifying Radicals
Graphs/Data Representation
100
What are the 5 things involved in the five-point summary?
What are the minimum, quartile one, median, quartile three, and maximum?
100
What is the probability that you roll an odd number on a standard six sided die?
What is 1/2
100
(x2+3) + (3x2-3)
What is 4x2
100
Find the GCF of 12, 16, 18
What is 2?
100
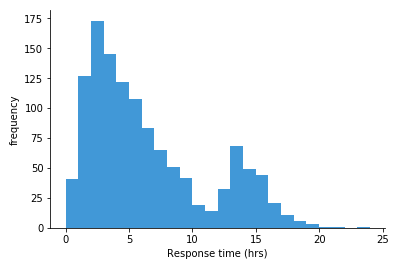
What is this type of graph called?
What is a Histogram?
200
Find the mean, median, mode, and range of the following data set:
3,7,2,5,9,1,4,8,6,3,7,5,10,2,6
What is Mean: 5.2, Median: 5, Mode: 2,3,5,6,7, Range: 9
200
What is the probability that I do not roll and odd on a dice that goes from 1-67?
What is 33/67?
200
(2x2 + 3x - 1) - (4x2 + 3)
What is -2x2 + 3x - 4
200
Find the LCM of 125x2 y5, 80x y2
What is 2000x2y5?
200
Create a dot plot for the following data set:
3,7,2,5,9,1,4,8,6,3,7,5,10,2,6
What is SEE BOARD
300
Make a Box and whisker plot for the following data set:
3,7,2,5,9,1,4,8,6,3,7,5,10,2,6
What is Minimum: 1, Q1: 3, Median: 5, Q3: 7, Maximum: 10
300
What is the probability that I flip a coin and get 10 heads in a row?
What is 1/1024?
300
(x + 3)(x2 - 1)
What is x3 - x + 3x2 - 3
300
What is the square root of 45?
What is 3 square root 5?
300
If I want to use a visual representation to see how much of the whole something represents I should use which type of graph?
What is a Circle Graph/Pie Chart?
400
The range of the data set below is 15. What is the missing number that needs to be included in the data set?
4, 10, 12, 16, 8, 3, 10, 11
What is 18 or 1?
400
I have a jar with the following letter chips:
a, g, d, s, t, a, y, f, w, j, s, o, i
What is the probability that I pull a consonant or a letter that falls between a - m in the alphabet? (y is a vowel in this case)
What is 11/13 ?
400
(x2 - 3x + 3)(2x2 - 1)
What is 2x4 - 6x3 + 5x2 +3x - 3
400
What is the square root of 7566
What is the square root of 7566?
400
What is the difference between a bar graph and a histogram?
What are spaces?
also acceptable
What are ranges/categories?
500
Jeremy has 2 brothers and 3 sisters. His brothers are 2 years younger and 4 years younger than him. His sisters are 1 year, 4 years and 6 years older than him. Jeremy is 9 years old. What is the range of the ages of Jeremy and his brothers and sisters?
What is 10 years?
500
You have a jar that has 6 green marbles, 4 pink marbles, 7 blue marbles, and 9 orange marbles.
What is the probability that you pull a blue marble, don't replace, then pull a pink marble, do replace, and then pull a pink marble again?
What is 56/8125 ?
500
(x3 - 4x2 + 3x)(5x + x2 - 1)
What is x5 + x4 -18x3 + 19x2-3x
500
What is the square root of 824 x3 y4 z5
What is the 2 x y2 z2 square root 206 x z ?
500
A pie graph is drawn that shows that 25% of students enjoy math as their favorite subject, 25% like english, 10% like science, 15% like STEM, 5% like art, 13% like band, and 7% like Spanish. If 714 students like spanish, how many students in total were surveyed?
What is 10200 students?