Reading Venn Diagrams
Reading Two-Way Tables
Probability with Venn Diagrams
Probability with Two-Way Tables
100
How many people like maths and physics?

40
100
How many people like skateboards and snowmobiles?

80
100
What is the probability that a randomly chosen student likes both mathematics and physics?
40/100
100
What is the probability that a randomly chosen student eats breakfast and is aged 10 - 13?
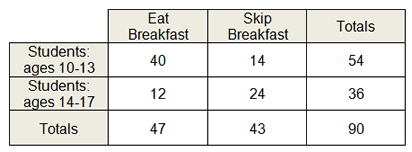
40/90
200
How many people do not like cookies or icecream?
8
200
How many people in total were surveyed?
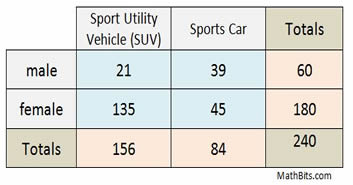
240
200
What is the probability that a randomly chosen person does not like cookies or ice cream?
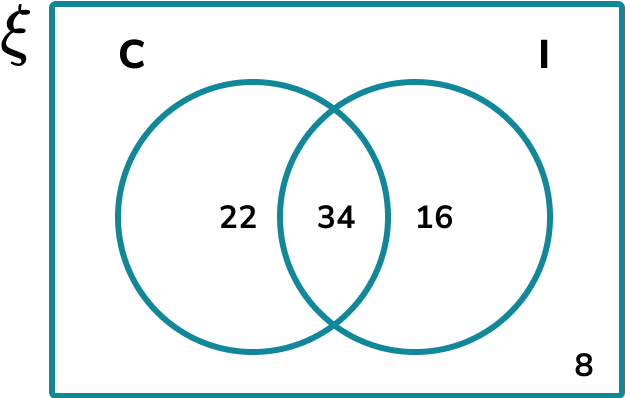
8/80
200
What is the probability that a randomly chosen person likes snowmobiles?
105/160
300
How many students like English but do not like Maths?
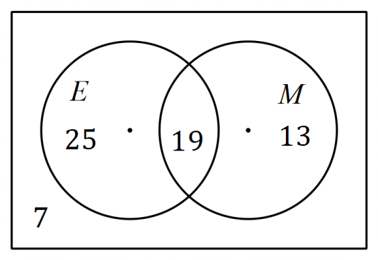
25
300
How many people in total like football?
42
300
What is the probability that a randomly chosen student likes English or Mathematics or Both?
57/64
300
What is the probability that a randomly chosen person likes football and likes chocolate?
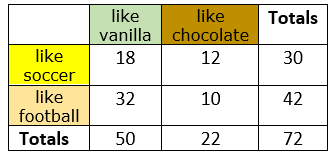
10/72
400
How many people in total like Maths?
32
400
How many people like snowmobiles but do not like skateboards?
25
400
What is the probability that a randomly chosen student likes anything that is NOT Physics.
40/100
400
How many Females like Physics?
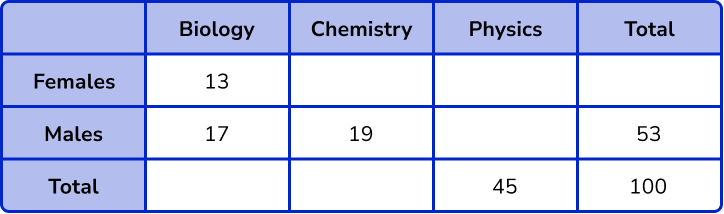
28
500
How many people like mathematics or physics or both?
90
500
How many people like vanilla and like football?
32
500
A group of 50 people were asked their gender and if they liked cats. The data from the survey are shown in the Venn diagram.
How many Females like cats?
13
500
How many Females like Chemistry?
6