Weather Tools
Vocabulary
Symbols
Weather Maps
Graphing & Data
100
What tool measures temperature?
thermometer
100
What is a meteorologist?
a scientist who studies and predicts weather
100
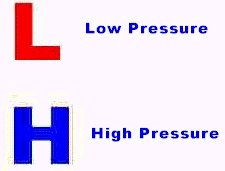
What letter and color represents a low pressure system? What letter and color represents a high pressure system?
100
Is California experiencing high or low pressure?
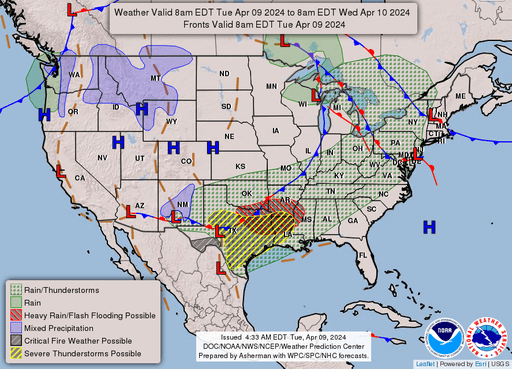
low pressure
100
Which sky condition was most common? How often?
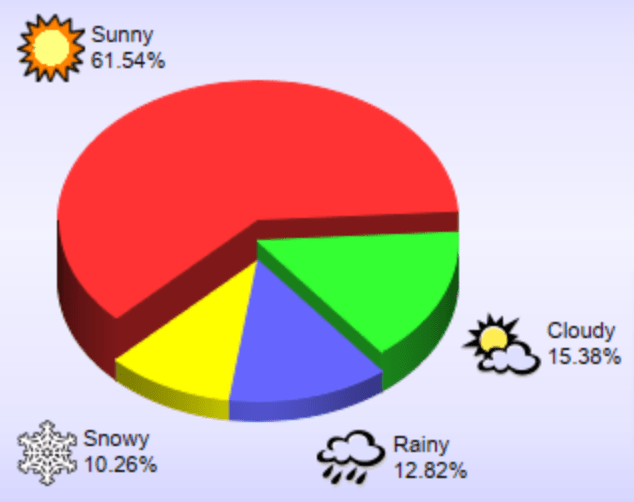
sunny (61.54%)
200
What tool measures air pressure?
barometer
200
Define precipitation and give an example.
Precipitation is any form of water that falls from the clouds to Earth. Examples include rain, snow, sleet, and hail.
200
In a front, what does the direction of the arrows/circles mean?
the direction that the front is moving
200
Name one state experiencing clear, sunny skies. Use evidence from the map to explain why.

Example: Colorado (CO)
Evidence: There is a high pressure system.
200
What season has the most precipitation?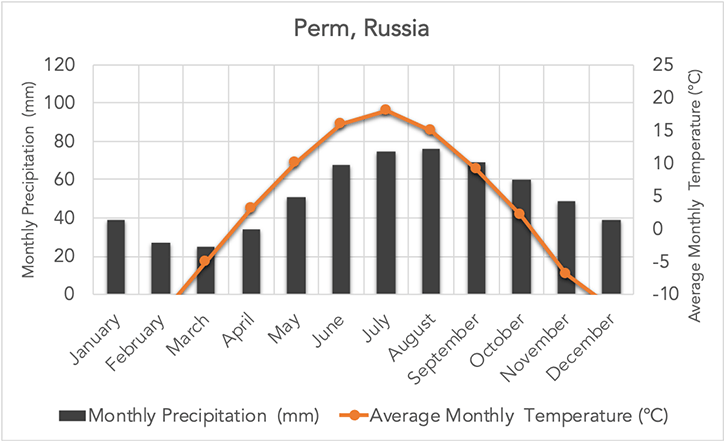
summer (the months of June, July, August have the tallest bars and therefore the most rain.)
300
What tool is this and what does it measure?
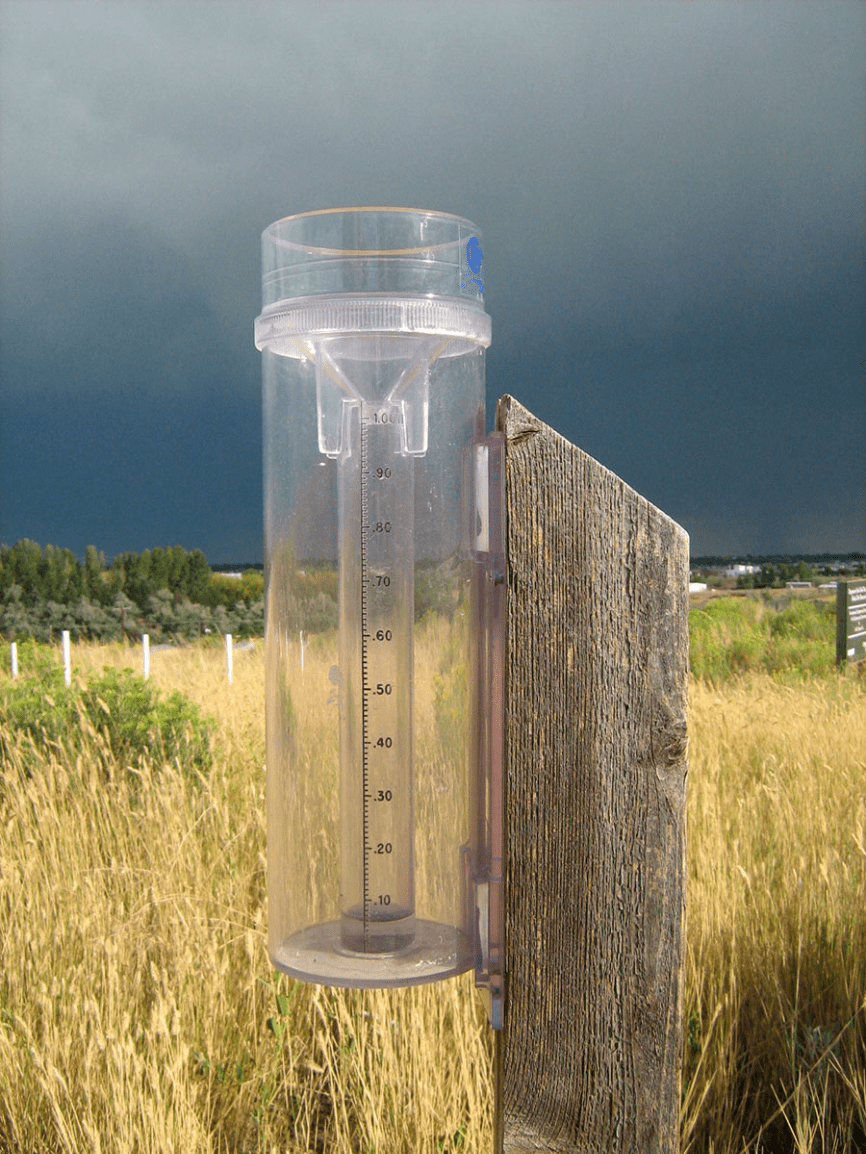
A rain gauge measures the amount of precipitation.
300
Clouds form when water on Earth ____ to become water vapor, and then cools and ____ to form clouds.
Clouds form when water on Earth EVAPORATES to become water vapor, and then cools and CONDENSES to form clouds.
300
What symbol is this?

occluded front
300
Why is there mixed precipitation in Washington (WA) but rain in Ohio (OH)? Use evidence from the map to explain why.
There is a cold front in Washington and a warm front in Ohio.
300
Are clear sunny skies more likely on Sept 25 or Oct 9? Why?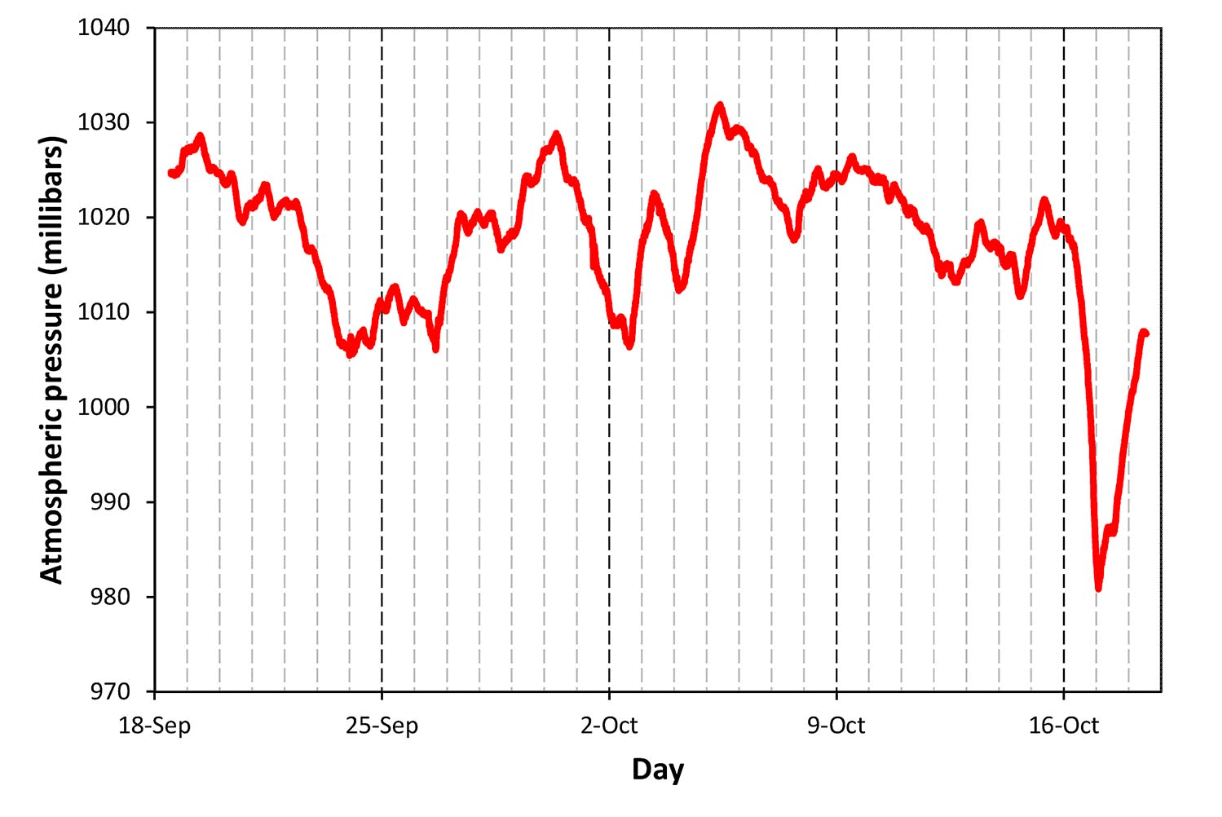
October 9 is more likely to have clear sunny skies because the air pressure is higher than on September 25.
400
What tool is this and what does it measure?
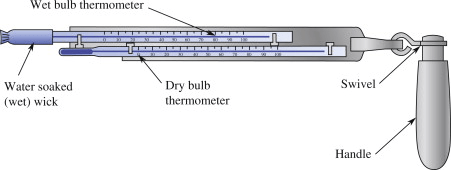
A psychrometer measures humidity.
400
What is the measure of the amount of vapor vapor in the air?
humidity
400
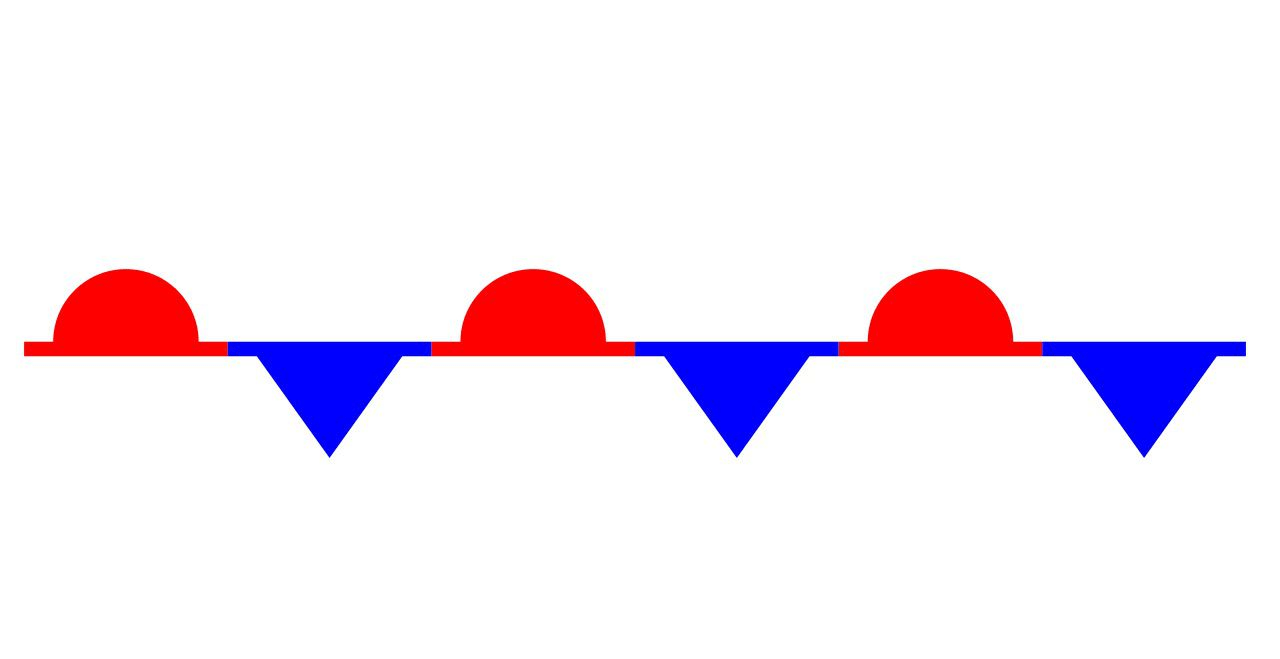
Describe the symbol for a cold front compared to the symbol for a warm front.
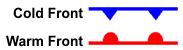
400
Forecast the temperature in Idaho (ID). Use evidence from the map to explain why.

Temperatures will decrease, so it will get colder. There is a cold front to the west of Idaho which will bring colder air as it moves east.
400
How does air pressure change as altitude increases?
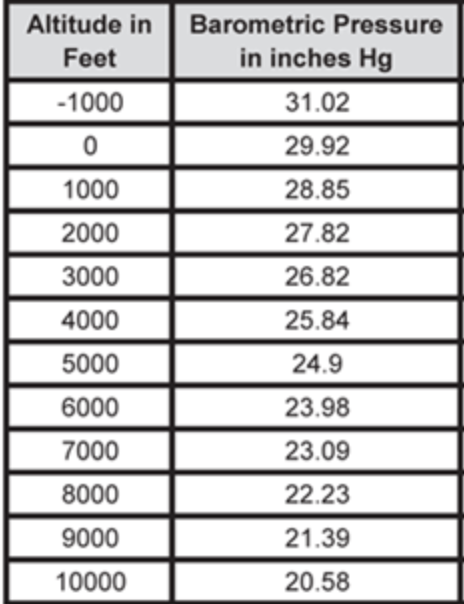
As altitude increases, air pressure decreases.
500
What two weather tools measure wind? Name the tools and explain what they measure.
A wind vane measures wind direction. For example, the wind is blowing from the northwest.
An anemometer measures wind speed. For example, the wind is blowing 12 mph.
500
Define front and give an example.
A front is where two air masses meet. Examples include cold front, warm front, stationary front, and occluded front.
500
Name the type of front, define it, and describe the associated weather.
A stationary front is when a warm air mass meets with a cold air mass and neither one moves. A stationary front brings long periods of cloudy, rainy weather with temperature differences on either side of the front.
500
Where is heavy rain? Use evidence from the map to explain why.

Location: southeast OK, part of TX that borders southern OK, and southern AR
Evidence: Key shows heavy rain and flooding
Why: stationary front
500
Explain what caused the weather at any time in the week.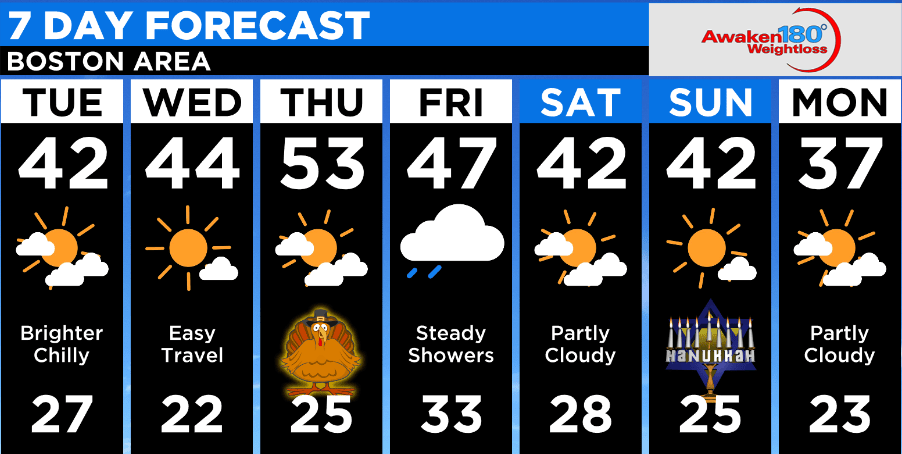
Example 1: A cold front moved in at the end of the week.
Example 2: Air pressure was higher on Wednesday than Friday.