Production Possibility Curve
Circular flow of income
Government Intervention and economic activity
Supply and demand
General
100
What does B, D, C represent?

Production is efficient.
100
What does the circular flow of income represent?
Demonstrates how money moves from producers to households and back again in an endless loop.
100
What is the key role of a fiscal policy?
All based around the budget. Governments way of stimulating the economy
100
A commodity that will be purchased in a market over a given time at a given price.
Demand
100
What countries made up the original Axis powers in World War II?
Germany, Italy, Japan
200
What does X represent?

Potential growth.
200
True or false
Money just moves around and changes forms.
True.
200
What is the key role of a monetary policy?
Policies that are influenced by the Reserve Bank of Australia.
200
List 2 factors that would influence demand.
Price
Income
Tastes
Population changes
Expectations
200
What's the city with the most diversity in terms of language? (hint: It's in America)
New York City
300
What does A represent?
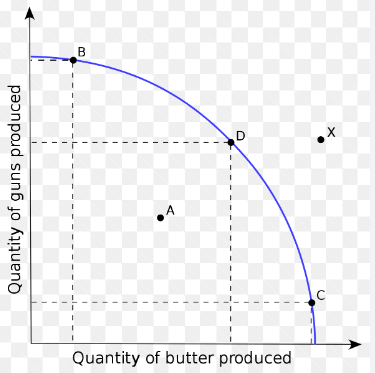
Underutilisation of production.
300
What does Y stand for in the circular flow of income?
Income.
300
What does 1 represent?
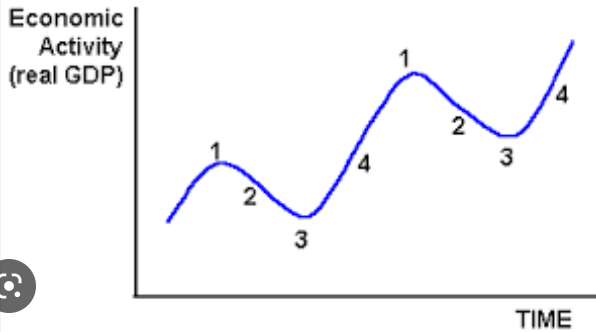
Boom or peak.
300
Redraw this S&D if a new oil well was found off the coast of the Gold Coast. How would this impact the graph.

Teacher to check
300
Which Disney Princess talks to the most animals?
Snow White
400
What would move the PPC outwards to the right?

Overall production increase.
400
What do the following letters stand for:
C + I + G + X
Consumer expenditure
Investment
Government spending
Exports
400
What does 3 represent?
A contraction or downturn.
400
Redraw this graph if it represented a change in consumer purchases of Dreamworld passes after the death in 2016.
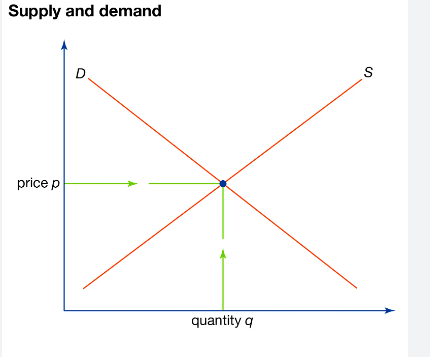
Teacher to check
400
Name one member of the the best band in the world "The Beetles"
John Lennon,
Paul McCartney,
George Harrison,
Ringo Starr
500
What is the purpose of of a PPC?
A graph that shows all of the different combinations of output that can be produced given current resources and technology.
500
What would cause the circular flow of income or economy to expand?
Injections are greater than leakages.
500
What does 4 represent?

Recovery.
500
Redraw this graph if the demand and supply both increase.

Teacher to check.
500
How old am I?
24