Classifying and Collecting Data
Frequency Tables
Measures of Centre and Spread
Dot Plots and Bar Graphs
RANDOM
100
What is this type of data called:
Examples: eye colour, languages spoken at home, favourite type of pet.
Categorical data
100
Number of people that participated in the survey.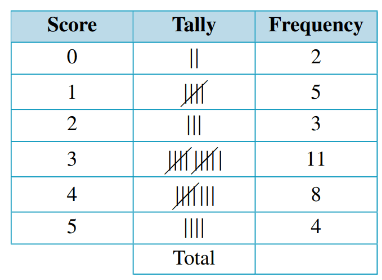
33
100
What is the capital city of New Zealand?

Wellington
100
The dot plot explains how many students do sport on how many days a week. What is the mode?
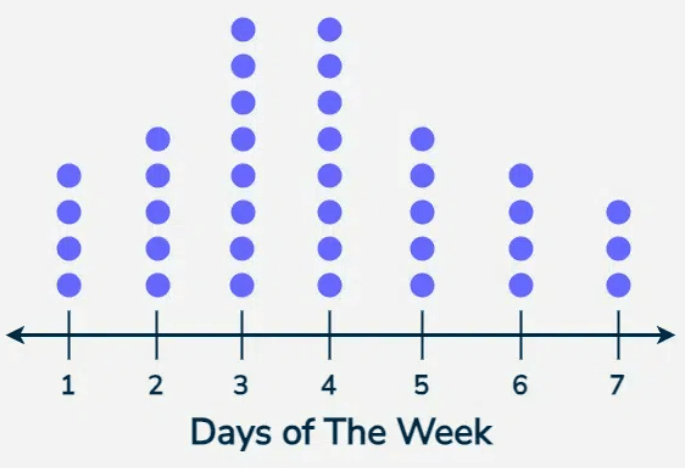
3 & 4
100
Determine the Mode:
1, 4, 7, 3, 4, 2
4
200
What is data that is counted called:
Example: number of people at school, numbers of pets in a house, how many squishies a person owns
Numerical data - discrete data
200
Most frequent Score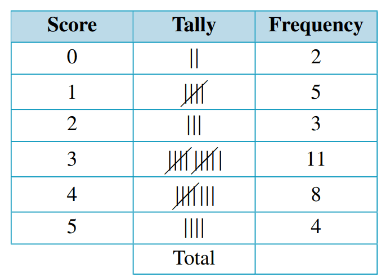
3
200
Calculate the Range:
6, 8, 3, 4, 7
5
200
What show is this character from?
Pokemon
200
Is there an outlier? And if so what is it? 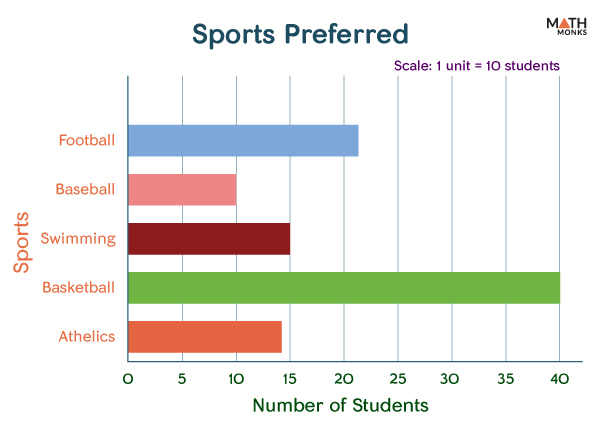
Basketball with 40 students
300
What is data called which is measured?
Example: the race time of students running 100 meters, the temperature during the day, the height of teachers,Numerical Data - continuous data
300
Number of people that scored less than 3
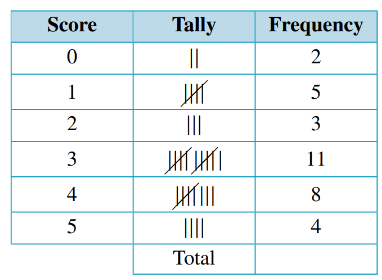
10
300
What is this character called in MineCraft?
Zombie Pigman
300
Create a dot plot from this data about students' favourite sports:
NRL: 9 students
Soccer: 2 students
Boxing: 5 students
Basketball: 7 students
No sports: 1 student
.
.
. .
. .
. . .
. . .
. . .
. . . .
. . . . .
NRL Soccer Boxing Basketball No sports
300
How many people on a team in soccer?
11 players
400
Data which is collected by someone else is called...
Secondary data
400
When is the best time to hunt wild pigs?
Dawn, dusk, and night
400
Calculate the Mean:
2.5, 1.3, 4.2, 2.1, 1.9
(2.5 + 1.3 + 4.2 + 2.1 + 1.9) divide 5
= 2.4
400
Create a column graph from this data about students' favourite colours:
Red: 5 students favourite colour
Blue: 1 student
Purple: 3 students
Green: 2 students

400
Name a specific punch in boxing.
(Jab): Quick straight punch with the lead hand to find distance and set up combinations.
(Cross): Powerful straight punch with the rear hand, rotating through the hip and back foot.
(Hook): Circular power punches aimed at the head or body with sharp shoulder and hip rotation.
(Uppercut): Upward vertical strikes used inside to break through a high guard
500
Name another adult in the classroom except for Miss Coates. You CANNOT ask them their name.
Miss Cousins or ...
500
Fraction of people surveyed who scored 3 (Must be simplified)
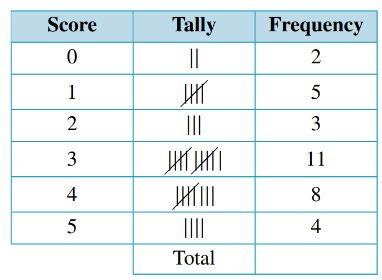
1/3
500
Determine the Median
2.2, 3.7, 3.5, 6.8, 6.1
3.7
500
Calculate the mean from this column graph:
Mean =
(21+10+15+40+14) divide 5
=20
500
How would you describe the distribution of this graph:

Skewed left/ negatively skewed
This means the mean is smaller than the mode and median