Level 1
Level 2 - 3
Level 4-5
Level 5 - 8
Level 9-10
100
What does "chance" mean in probability?
The likelihood of an event occuring.
100
True or False: Data collection is not needed for probability.
False
100
Which measure is most affected by outliers?
Mean (Average)
100
Why is fairness important in probability experiments?
To ensure unbiased results.
100
Give one reason why predictions may fail.
HINT: If a survey only asks 3 people, is it reliable?
Insufficient trials or biased data
200
True or False: Probability measures certainty only.
False
200
Name one way to represent data visually.
Histogram, scatter plot, bar graph, pie chart etc...
200
Calculate the mode of [1, 2, 2, 3, 4].
2 - Mode is the most frequent
200
Give an example of secondary data source.
HINT: A primary source is an experiment or observation you have done yourself
Published survey or research report
200
What type of chart is this?

Pie chart
300
Which of these is a random event?
a) Tossing a coin
b) Sunrise
c) Earth rotation
a)
300
Which measure compares spread of data? (difference between the smallest and the largest data)
Range
300
Express probability of rolling a 3 on a fair die as a fraction.
1/6
300
What does the Law of Large Numbers state?
As trials increase, experimental probability approaches theoretical probability.
300
What type of chart is this?

Bar chart - it says it in the image!
400
What is the term for something that can happen by chance?
Random event
400
True or False: Median is the middle value in ordered data.
True
400
Convert 0.25 probability to percentage.
25%
400
True or False: More trials reduce variability in results.
True
400
What type of chart is this?
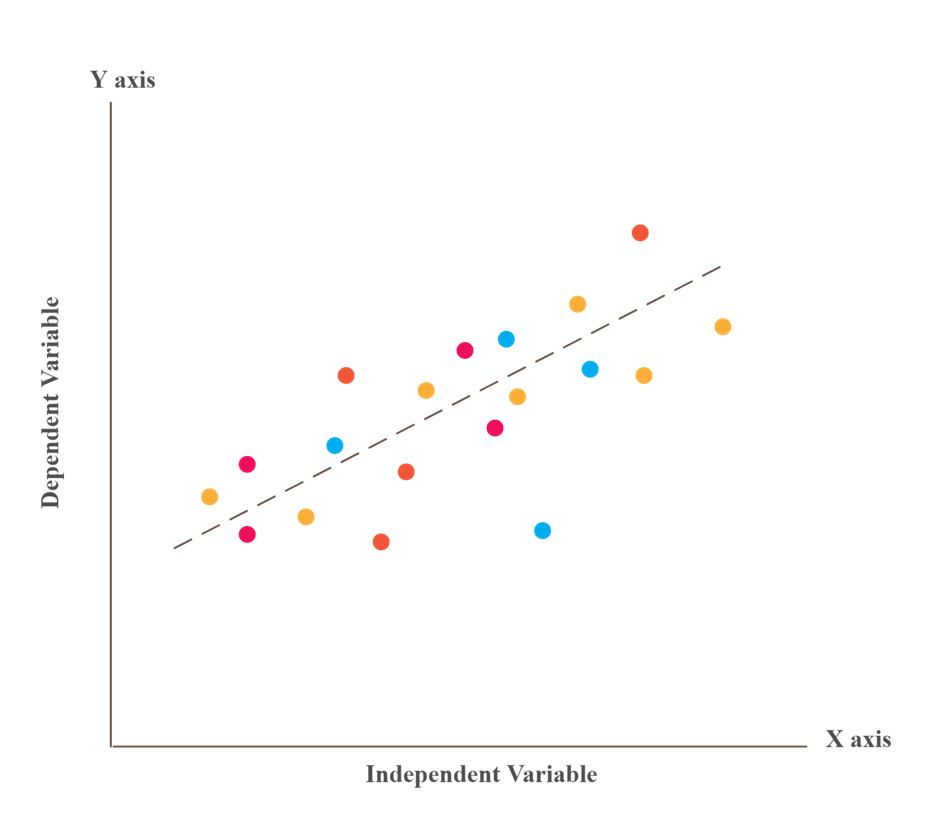
Scatter plot
500
Which graph is best for showing frequency of dice rolls?
Bar graph
500
If data set is [2, 4, 6], what is the mean?
4 (average. 2 + 4 + 6 = 12 /3 = 4)
500
What is the purpose of simulation in probability?
To model and predict outcomes of random events.
500
How can you justify a conclusion in probability?
By comparing experimental and theoretical probabilities.
500
What type of chart is this?
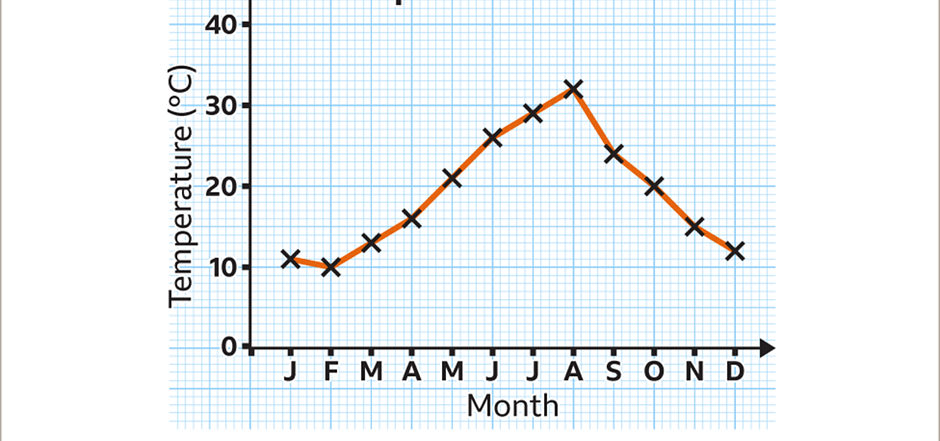
Line graph