Mean, median or mode: which one would we use for summarising data about peoples' favourite colours?
Mode--can't do mean or median for this data!
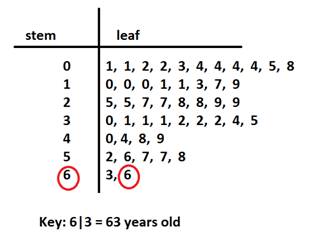
What is the range of the following stem and leaf plot?

43 - 7 = 36
True or false: if a data set has a range of 50, the IQR will be half of this (25).
False--range does not influence IQR
What is the median of the following data set?
0, 3, 8, 4, 5, 9, 1, 1, 8, 8, 12, 14
0, 1, 1, 3, 4, 5, 8, 8, 8, 9, 12, 14
Halfway between 5 & 8 = 6.5
The following histogram shows the marks out of 10 received by students on a recent test.
How many students were surveyed?
20
Q2 of a data display is commonly referred to as the __________, and ______ of the values in the data set will be higher than it.
median
50%
For his upcoming concert, Kendrick Lamar is selling:
1000 mosh pit tickets for $100 each
2000 seated tickets for $80 each
5 exclusive back stage passes for $2,000 each
Pete says that tickets to the concert "are about $90."
Paul says "no, they're actually only $80."
Who is more accurate, and why?
Paul is using median, Pete is using mean.
Median is better here because of the outliers.
The following data values are the number of points scored by basketball team over their last 20 games:
46, 48, 43, 27, 2, 10, 44, 45, 27, 37, 49, 40, 12, 35, 44, 37, 4, 9, 26, 11
If you were making a grouped frequency table with the intervals 0-, 10-, 20- etc., what would the frequency be for the interval 30-?
3 - 35, 37 and 37 are in this interval
By performing the calculation Q3 - Q1, you are finding the __________ of a data set.
IQR (interquartile range)
Describe the shape and centre of this stem and leaf plot showing the ages of 47 people (200 for each)

Shape: skewed
Centre: Median is 28 years old.
The following data values are the number of points scored by basketball team over their last 20 games:
46, 48, 43, 27, 2, 10, 44, 45, 27, 37, 49, 40, 12, 35, 44, 37, 4, 9, 26, 11
If you were making a grouped frequency table with the intervals 0-, 10-, 20- etc., what would the percentage frequency be for the interval 40-?
8/20 x 100 = 40%
For the following stem and leaf plot, what is Q2?

23.5
You survey 5 randomly chosen people at Northland about how much they just spent on their shopping. Their responses were:
$20, $49, $81, $166, $10000
When you check their receipts, the person who said $10000 was lying, and they actually only spent $200. Does this new value change the mean, median, or both?
Mean only, median stays the same
The following back-to-back stem and leaf plot shows the marks out of 100 on a recent essay task for two different classes. Which class did better on the test? Justify your answer, using an appropriate statistic.

Class 2 has a higher median
Class 1 has a higher mean
No outliers, so either option could be correct. In other words, both classes did similarly well.
For the following stem and leaf plot, what is Q3?

30