Types of Data
Graphs
Box Plots
Mixed
Mean, Median, Mode
100
The heights of people in the classroom
What is numerical data
100
Used to represent categorical data
What is a column graph
100
The difference between the lowest and highest value of a data set
What is the range
100
The second column of the frequency tables (usually)
What is the tally
100
The average score in a study of data
What is the mean
200
Color of peoples eyes in Year 9
What is categorical data
200
Used to represent continuous numerical data
What is a histogram
200
75% of the study is above this point
What is the lower quartile
200
What is shown up the left side of column graphs?
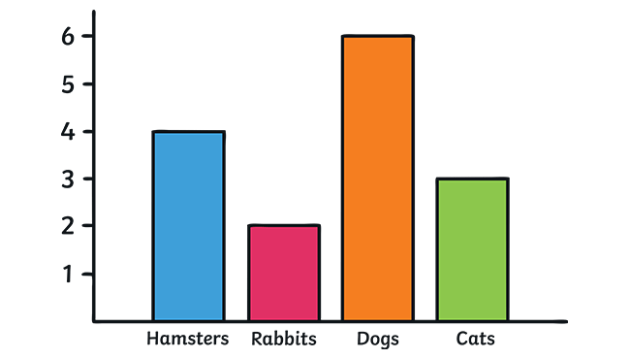
What is frequency
200
This must be done prior to working out the median of a data set
What is putting the data in order
300
Speed of cars along a highway
What is continous data
300
When all the data on the graph is spread out evenly
What is a symmetrical graph
300
The difference between the upper and lower quartiles that represents the middle 50% of the study
What is the inter quartile range
300
What type of data would you collect to display in a pie chart?

What is categorical data
300
When more two modes exist in a data set
What is bi-modal
400
Flavours of ice cream ranked from least favorite to most favourite
What are categorical - ordinal data
400
When majority of the data in a graph is towards the left hand side
What is positively skewed
400
Who checks social media more often on average?

Women
400
A histogram is used to display which type of data: categorical or numerical?
What is continuous numerical data
400
Calculate the median of the following data:
2, 3, 7, 5, 8
Mean = 5
500
The number of recycling bins at the school
What is Numerical - discrete data
500
Most appropriate graph to use when we have two sets of data and want to display them next to each other
Back-to-back (stem and leaf plot/column graph)
500
If one value in a dataset is much larger or smaller than the others, what is it called?
What is an Outlier
500
What is the most common height AND how many people surveyed have that height?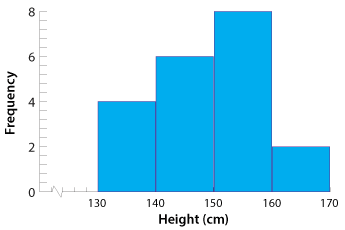
150-160cm, 8 people
500
This graph shows the spread of the Australian population across generations. On average what percentage of the population is roughly in each column?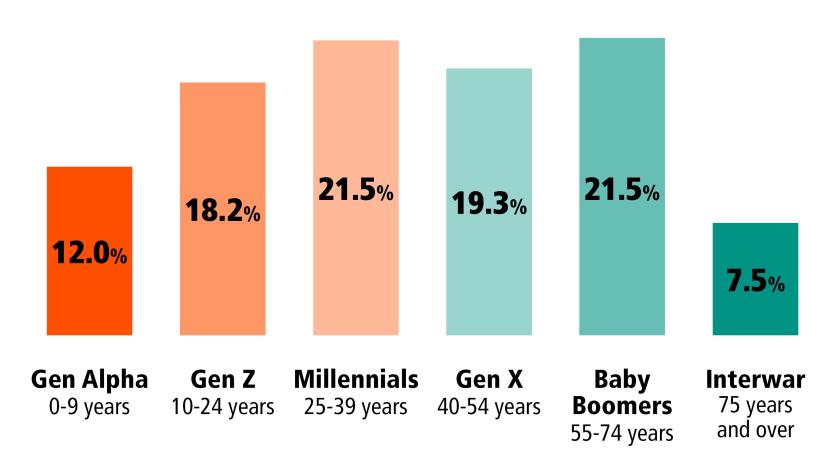
What is 16.6% (I'll take anywhere between 15-20%)
100 / 6 = 16.67%