Cartesian Planes
Linear Functions
Correlation
Interpolation and Extrapolation
100
Which axis runs horizontally?
x axis
100
The independent variable is placed on the y-axis when graphing. True or False
False, the independent variable is always placed on the x axis.
100
Why are scatterplots used the most when comparing bivariate data?
Can compare two variables to see if there is a relationship/association.
100
what does interpolation mean?
Interpolation is estimating a value within the range of known data points.
Example: Estimating the temperature at 12pm when you know it at 10am and 2pm.
200
What coordinates are g and f?

g. ( -3, 3)
f. (-3, 0)
200
What is y, if x=2
y=x-4
-2
200
What does it mean when there is no correlation?
There is no relationship between the two variables
200
what does extrapolation mean?
Extrapolation is estimating a value outside the range of known data points.
Example: Predicting next year’s temperature based on past years.
300
which quadrant is (-4, -2) in?
Quadrant 3
300
What is the formula for line of best fit?
y=mx+c
300
What correlation (direction, strength and shape) does this scatterplot show?
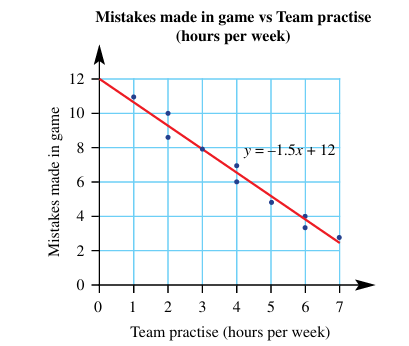
Negative, strong, linear
300
Determine which dataset A, B or C would be the least reliable based on the correlations stated. Explain your response.
A. Weak linear negative
r = 0.75.
Strong positive
The least reliable dataset is A (weak linear negative).
- The value of (r) would be close to 0 (but negative)
- The data points are loosely scattered
- Predictions made from this dataset are unreliable
400
A(2, 3), B(-4, 1), C(2, -5), D(-3, -2).
Identify the quadrant of each point.
*HINT*

A - Quadrant 1
B - Quadrant 2
C - Quadrant 4
D - Quadrant 3
400
In the equation y=mx+c what does "m" and "c" stand for?
m= slope/gradient
c= y intercept
400
When analysing correlation what are my 3 different types of correlation
- Direction (Positive or negative)
- Shape (Linear or Non-linear)
- Strength (Strong, Moderate, Weak or No correlation)
400
Explain why interpolation is generally more reliable than extrapolation.
Interpolation is generally more reliable than extrapolation because it estimates values within the range of known data, where the trend is already observed and supported by evidence.
500


500
Subsitute x= -3
y= 3 - 4x
y=15
500
Based on the correlation coefficient (r) 0.21, describe what correlation this would have.
weak positive correlation
500
Discuss how interpolation is used in real-world applications (e.g., finance, weather, engineering)
Interpolation is used in real-world fields like finance, weather, and engineering to estimate unknown values within a known range of data. It helps fill gaps when measurements are not continuous, allowing for more accurate predictions and informed decisions. Because it relies on existing data, it is generally reliable when the trend is consistent.