R Code
Equations
Anova Table
Linear Model
Random
100
The code to produce the first six rows of a data set
What is head(data_set)?
100
Another word to say n-1
Degree of Freedoms
100
The code for Anova table
What is supernova()
100
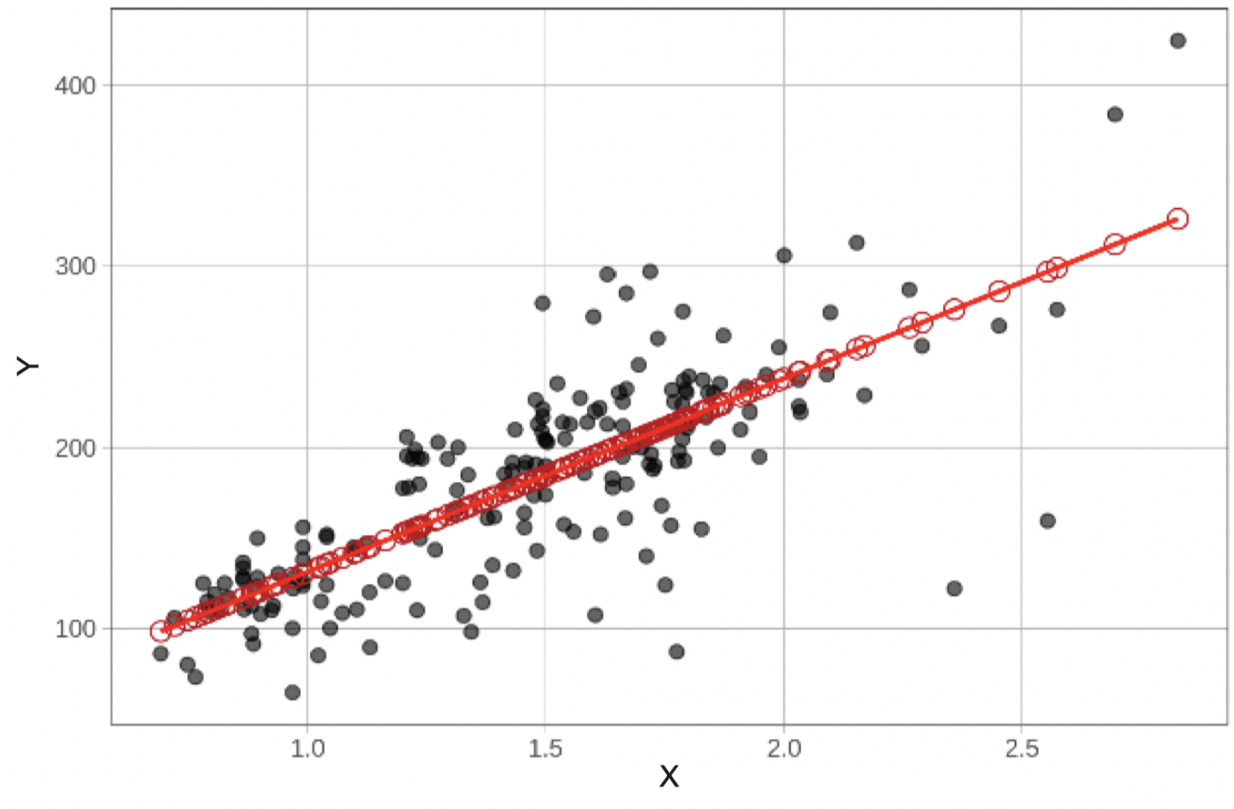
The red line from the point to the line is best known as 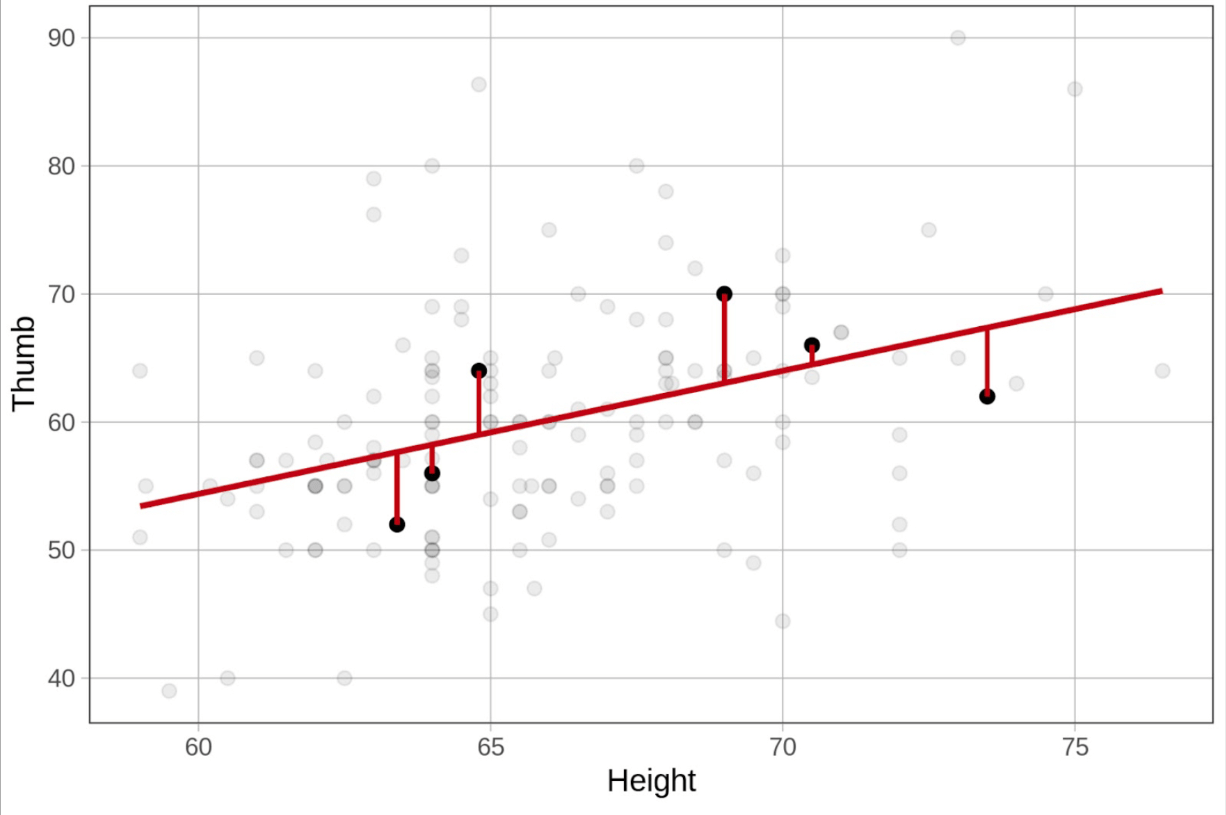
What is error or residual?
100
Statistics and Parameters differences are? Some examples?
What are characteristics of samples and characteristics of populations. 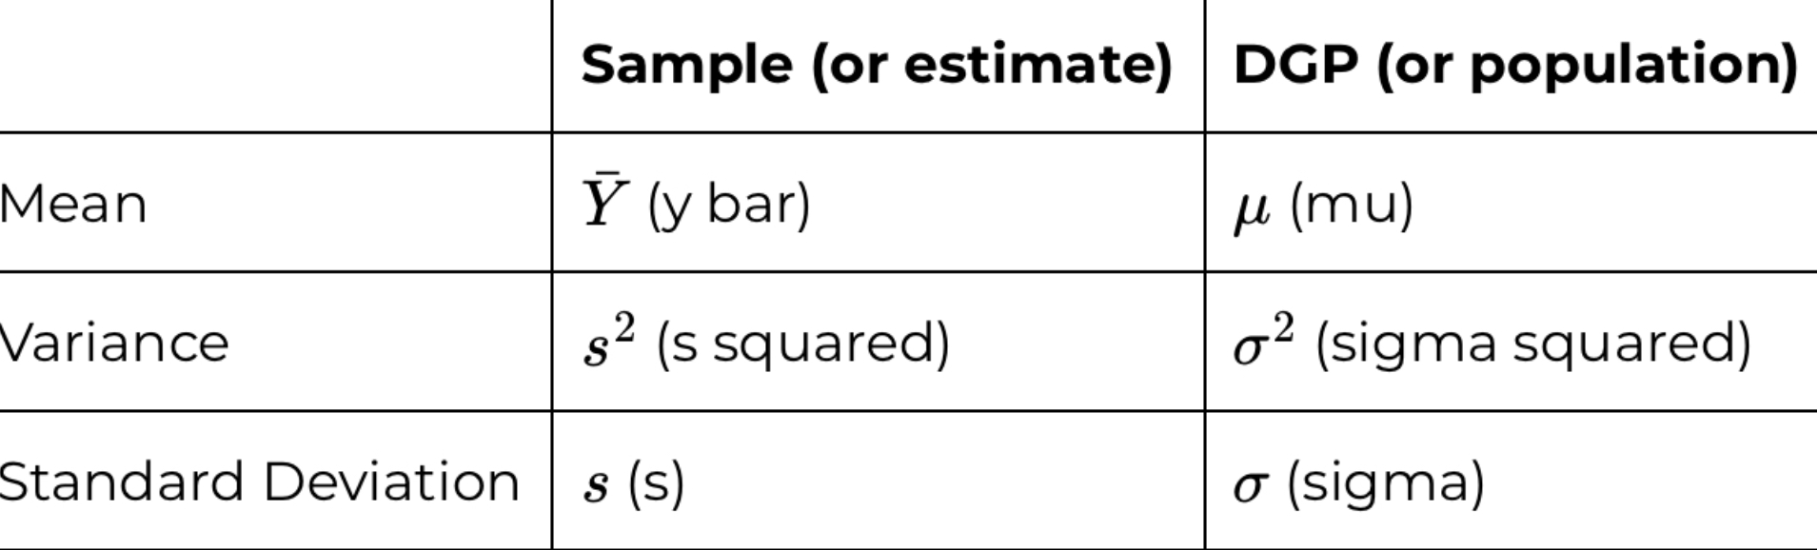
200
The code favstats()
What is the five-number summary? Min, Q1, median, Q3, Max. As well as mean, sd, and n
200
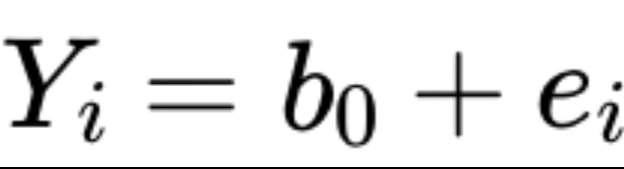
The empty model ?
Outcome = model (mean) + error
Yi = y bar + ei
200
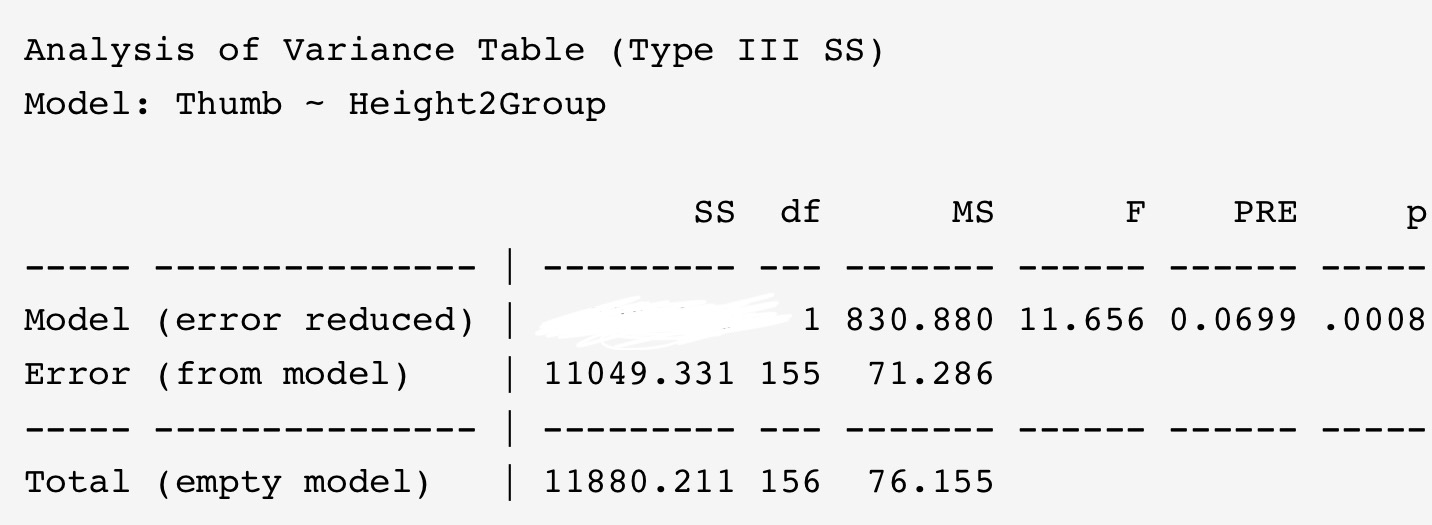
The missing number from the Anova Table
What is 11880.211 - 11049.331 = 830.88
200
Having 3 groups instead of 2, the general linear model would be?

200
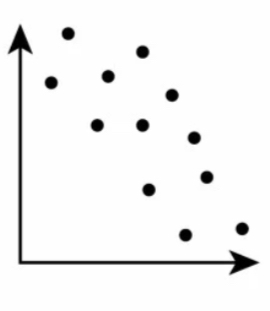 The correlation Coefficient (rough estimate)
What is -0.5
300
The code cor()
What is correlation coefficient? Aka r
300
The General Linear Model
300
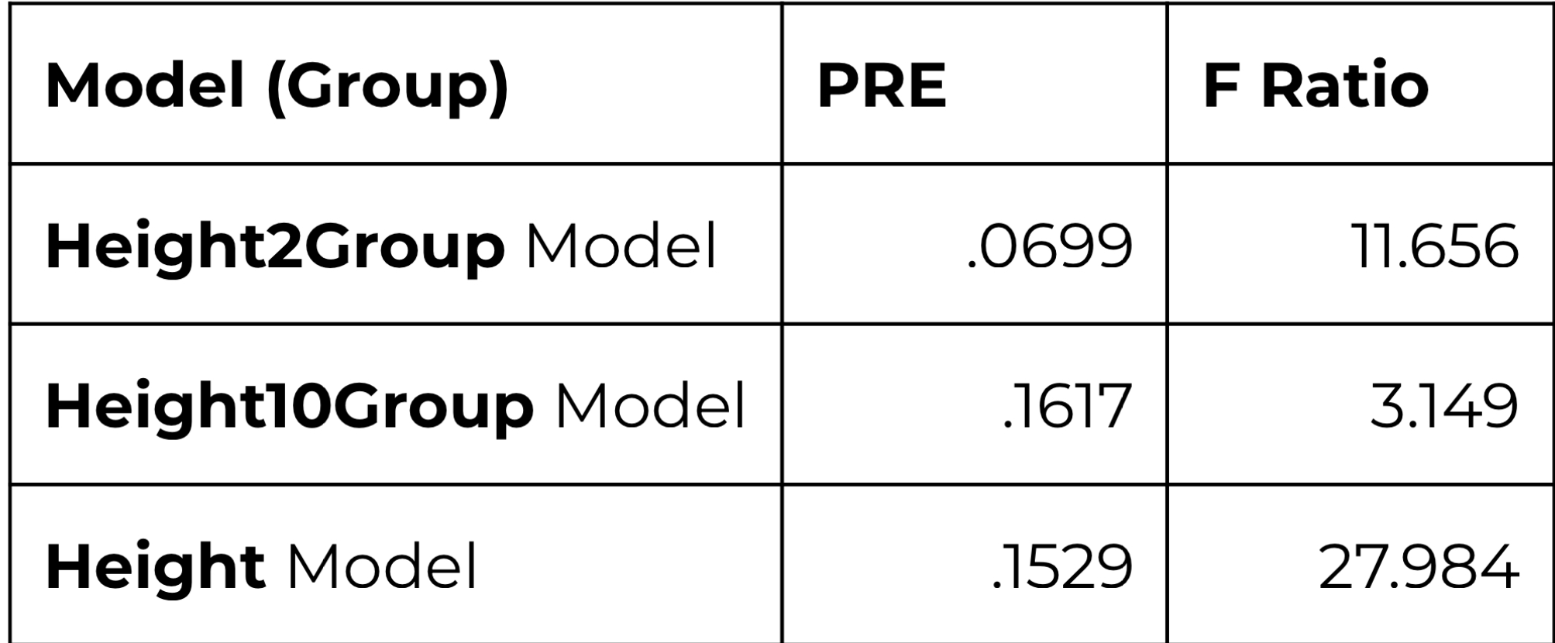
Which model is better at reducing error and why?
Height model because the F ratio is higher meaning it reduced more error. F takes into account degree of freedom which pre doesn’t
300
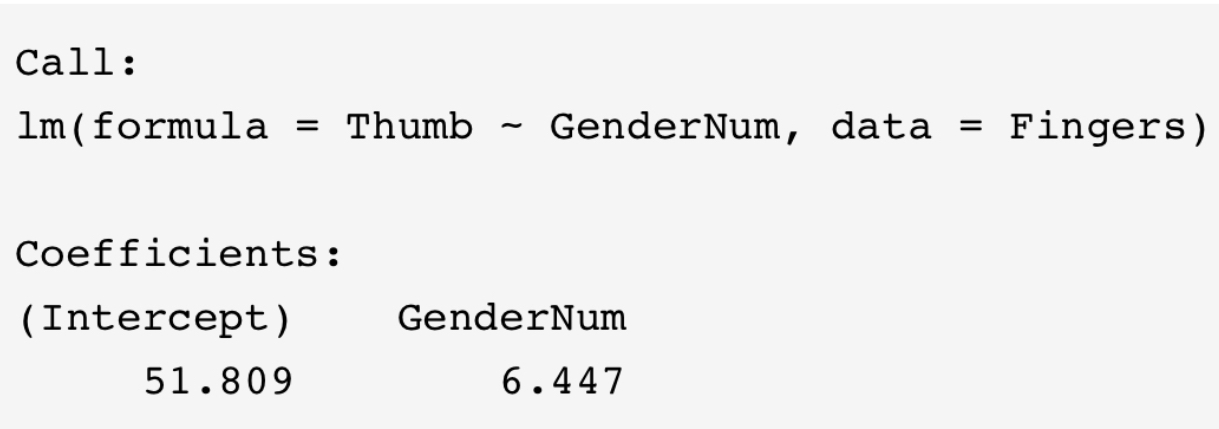 For each additional increase in GenderNum the expected/predicted thumb length …
What is an increase by 6.447
300
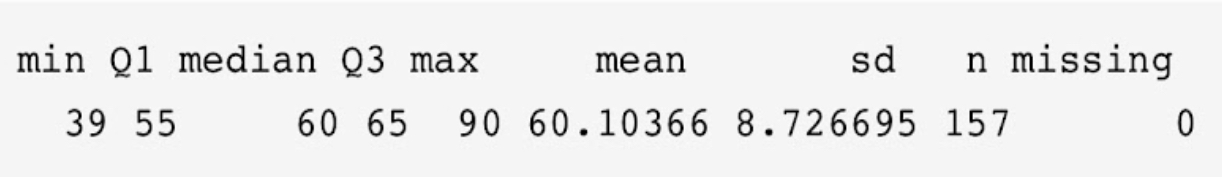 The z score for someone with a score of 70
What is 1.134. Code: zscore(data_set$Y)
400
The code xpnorm() needs what in the () and what does it calculate
What is data point (q), data set mean, and data set S.D? Calculates probability area of data point and below
400
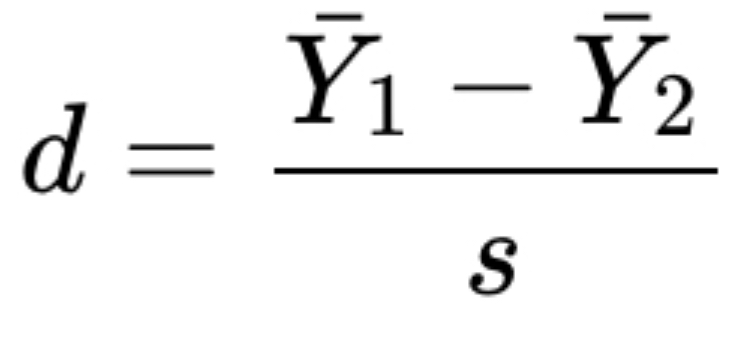 This equation is better known as
What is Cohn D? It measures the effect one variable has on the other. Code: CohensD()
400
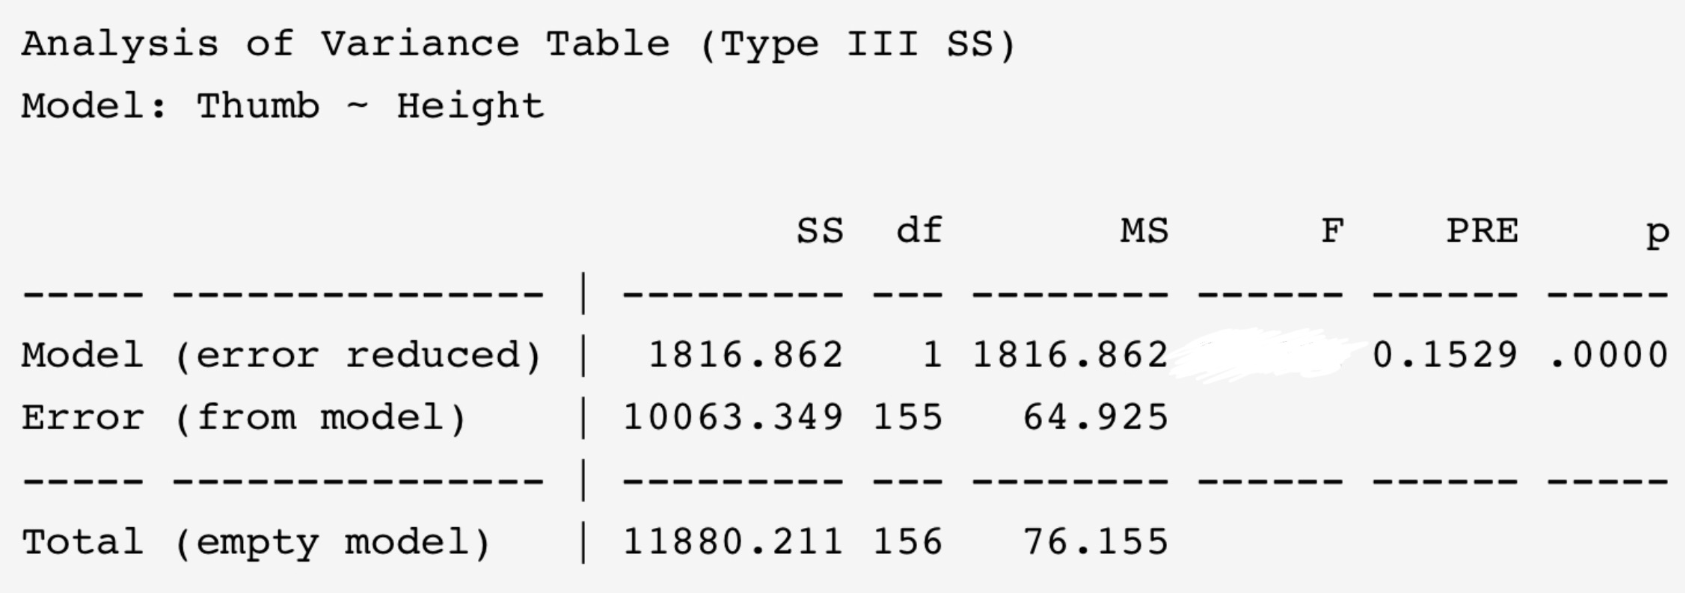 With this Anova table F would be?
What is 1816.862 (SS) / 64.925 = 27.984
400
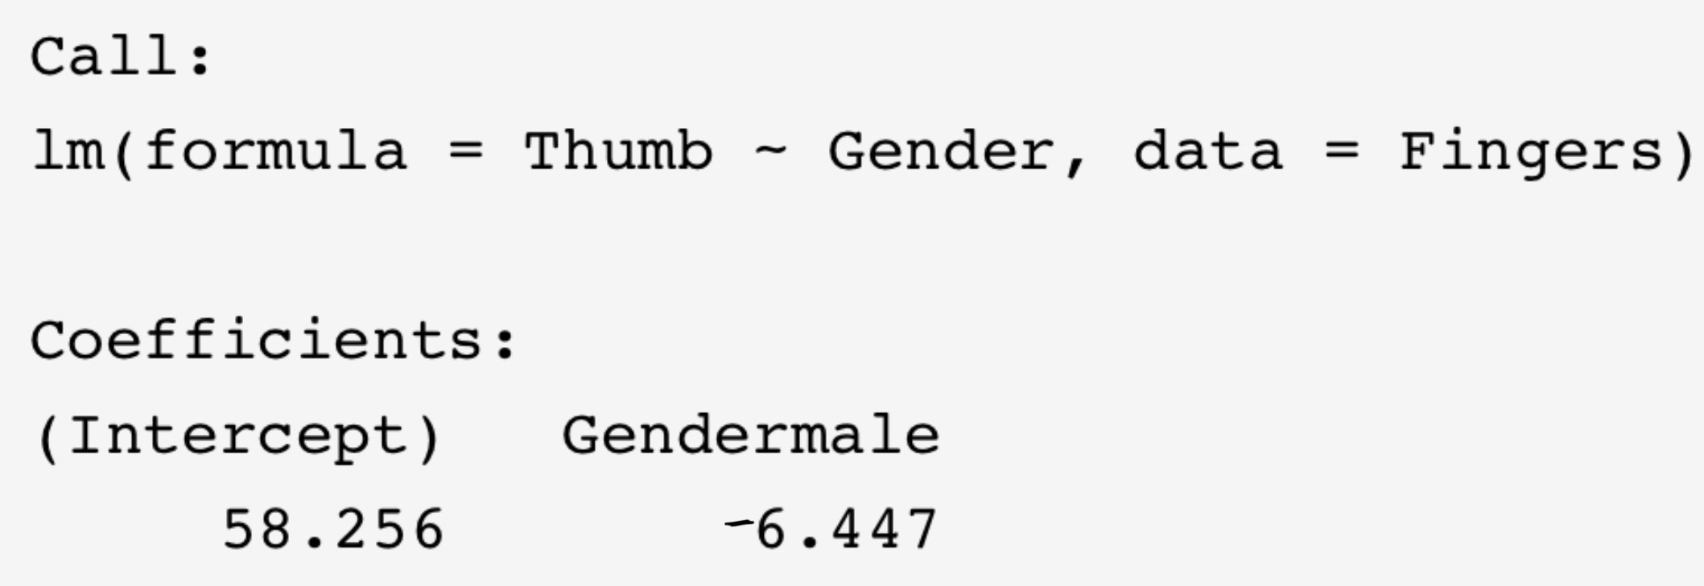 The general linear equation is written
What is Thumbi = 58.256 - 6.447 Gendermale i + error i
400
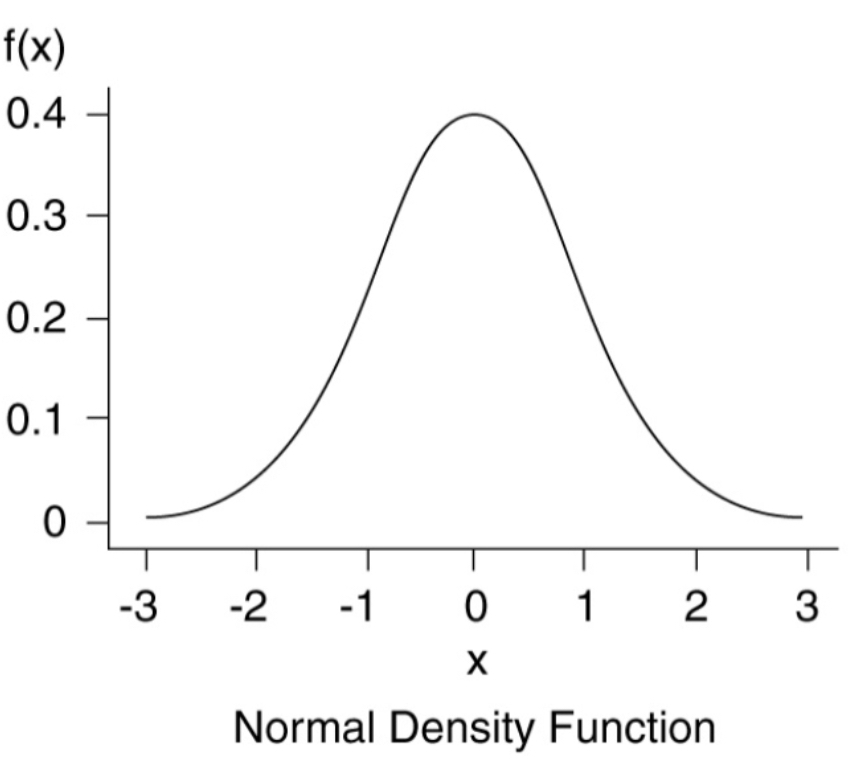 The code dnorm (0, mean = 0, sd =1 )
What is 0.4.
500
 The code for this ?
gf_point —> Scatterplot
gf_model —> best fitting model aka red line
500
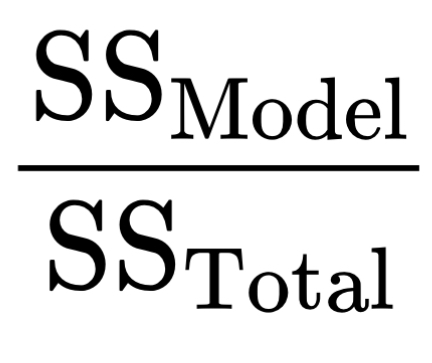 The equation is best known as
What is the pre equation?
500
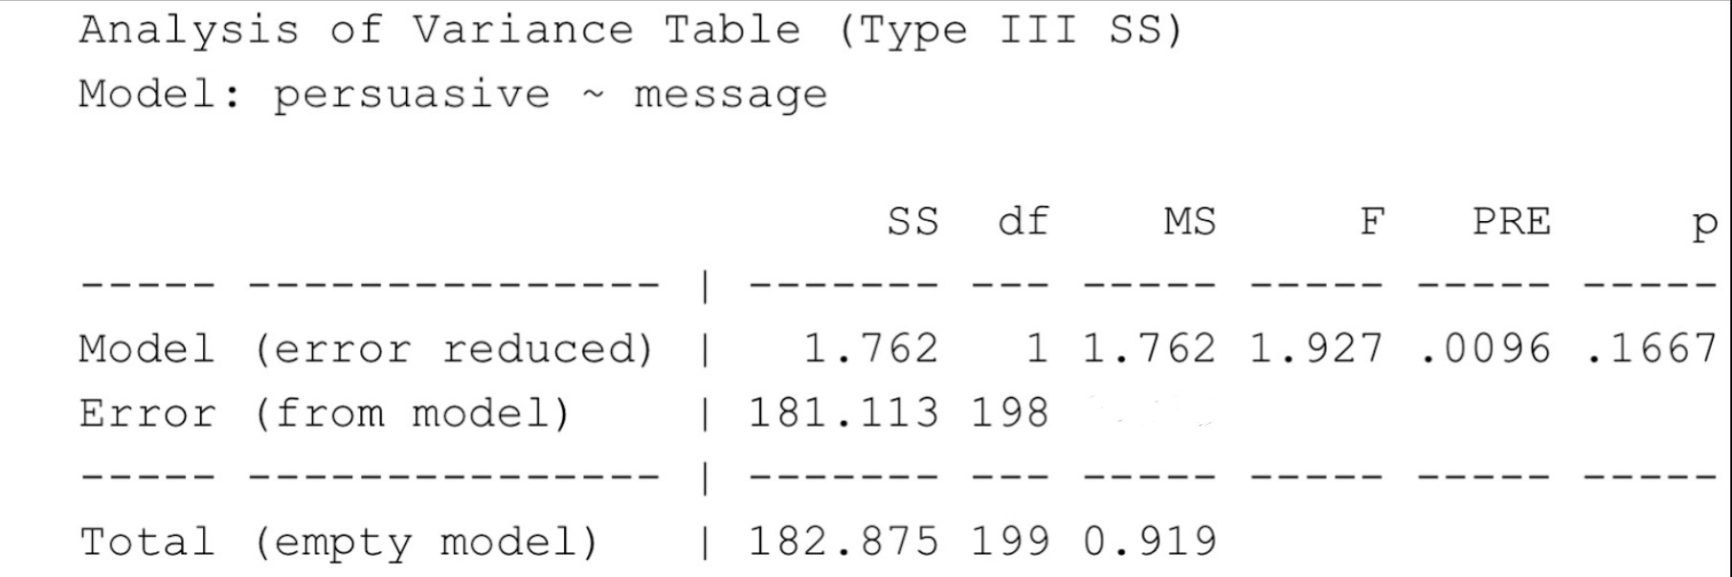 The standard deviation from this data set (hint a number is missing)
What is 181.113/198 = 0.915. Square root of that = .956
500
 The error of someone with height of 70 and thumb length of 71
What is 71 = 63.87 + error
Error = 7.13
500
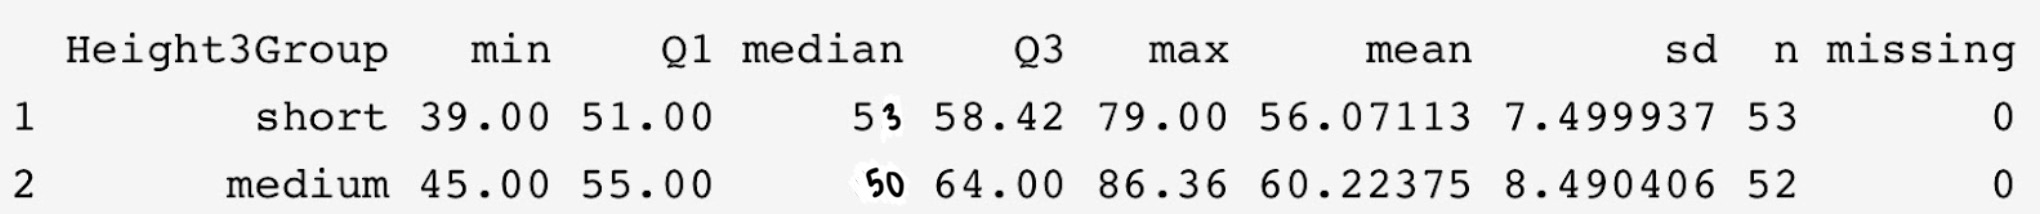 Using median and mean graph this and which has the highest thumb length
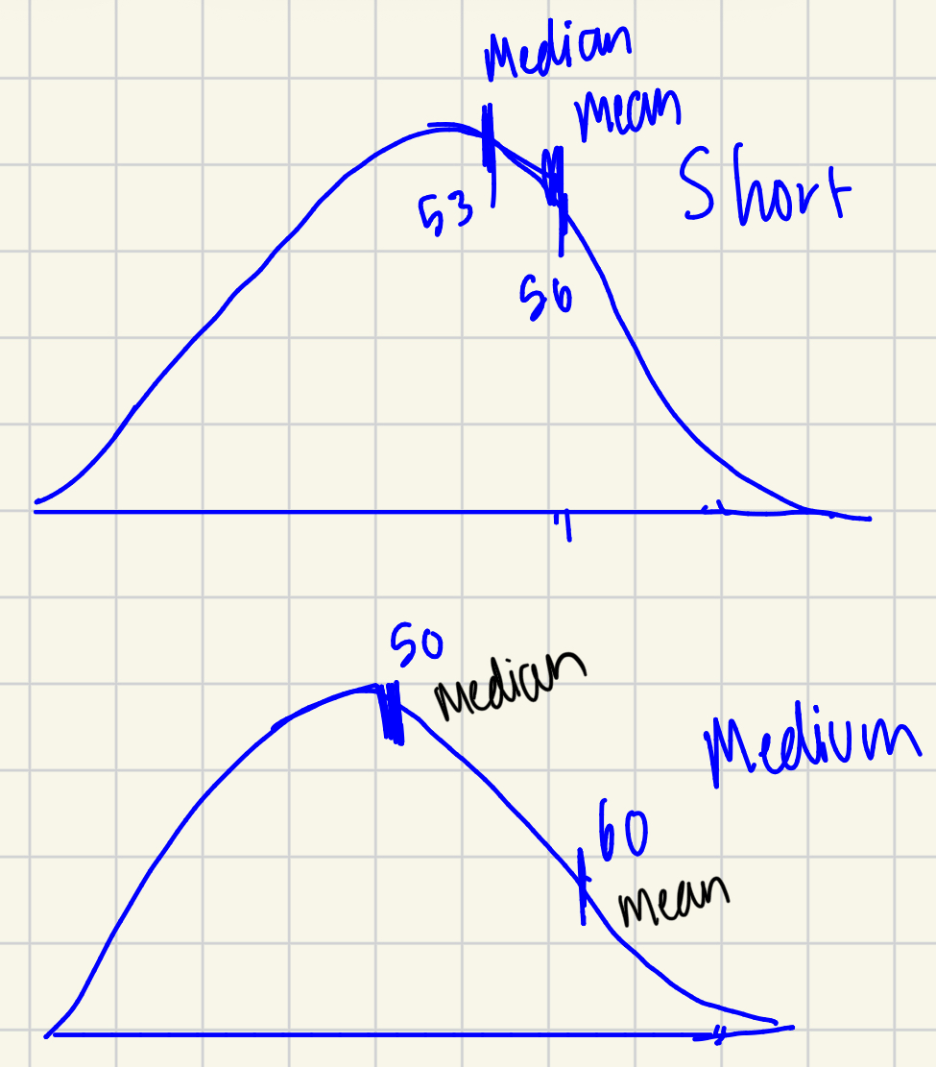 Depends on criteria. Mean it would be Medium. Median it would be short
600
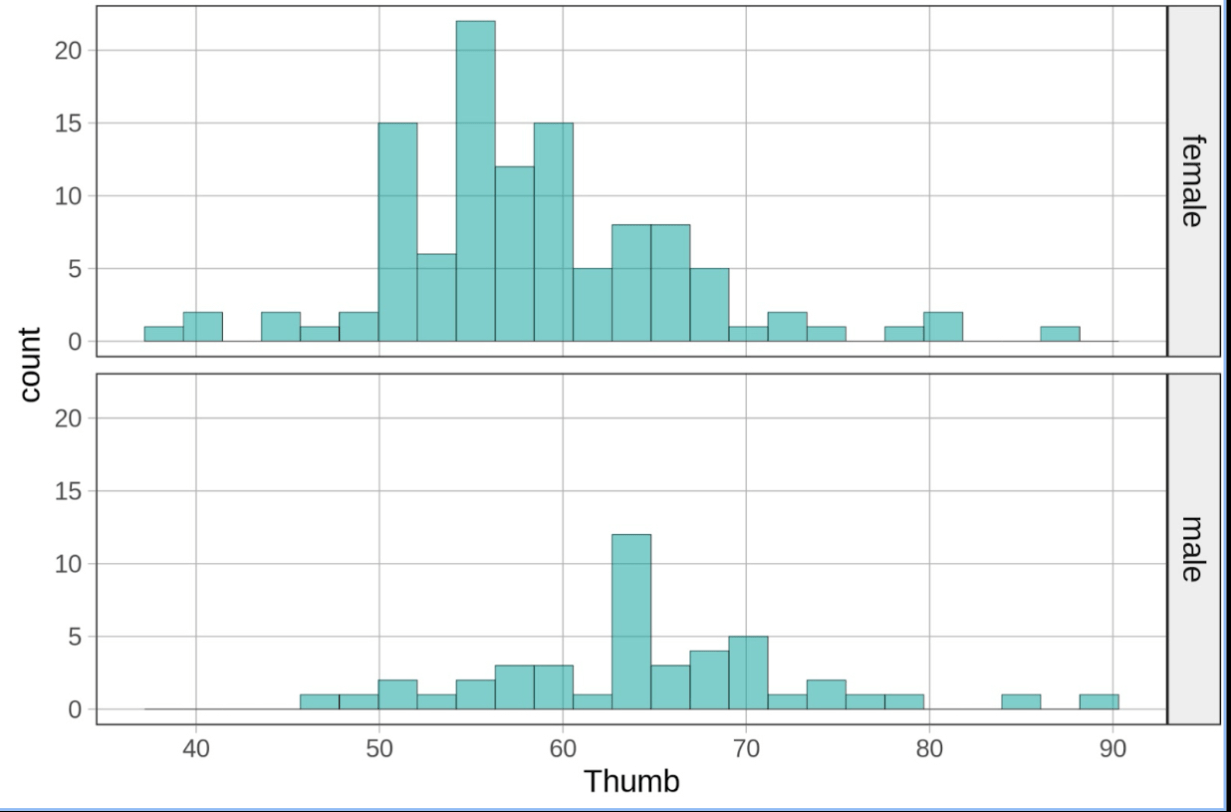 The code for this
gf_histogram (~y, data = data_set) %>% gf_facet_grid(X~ .)
600
The standard deviation equation:
Start with SS, variance and then S.D
What is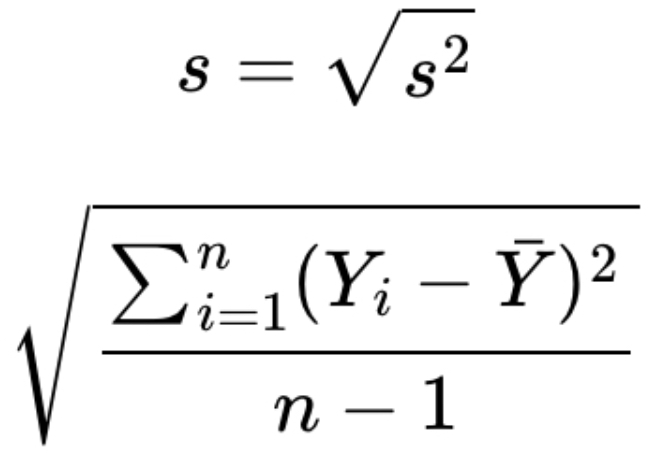 Code: sd(data_set$Y)
600
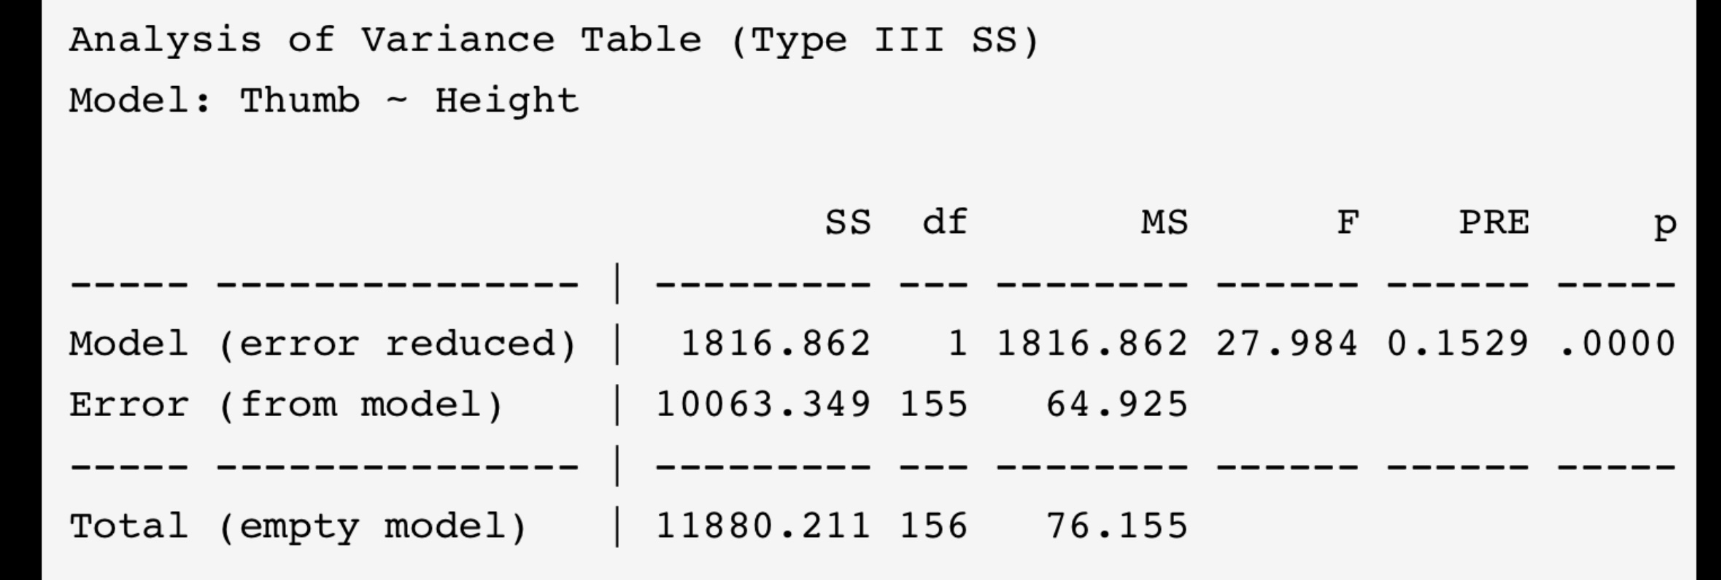
____% of the variability in ______ can be explained by _____
What is 15.29, thumb, Height
600
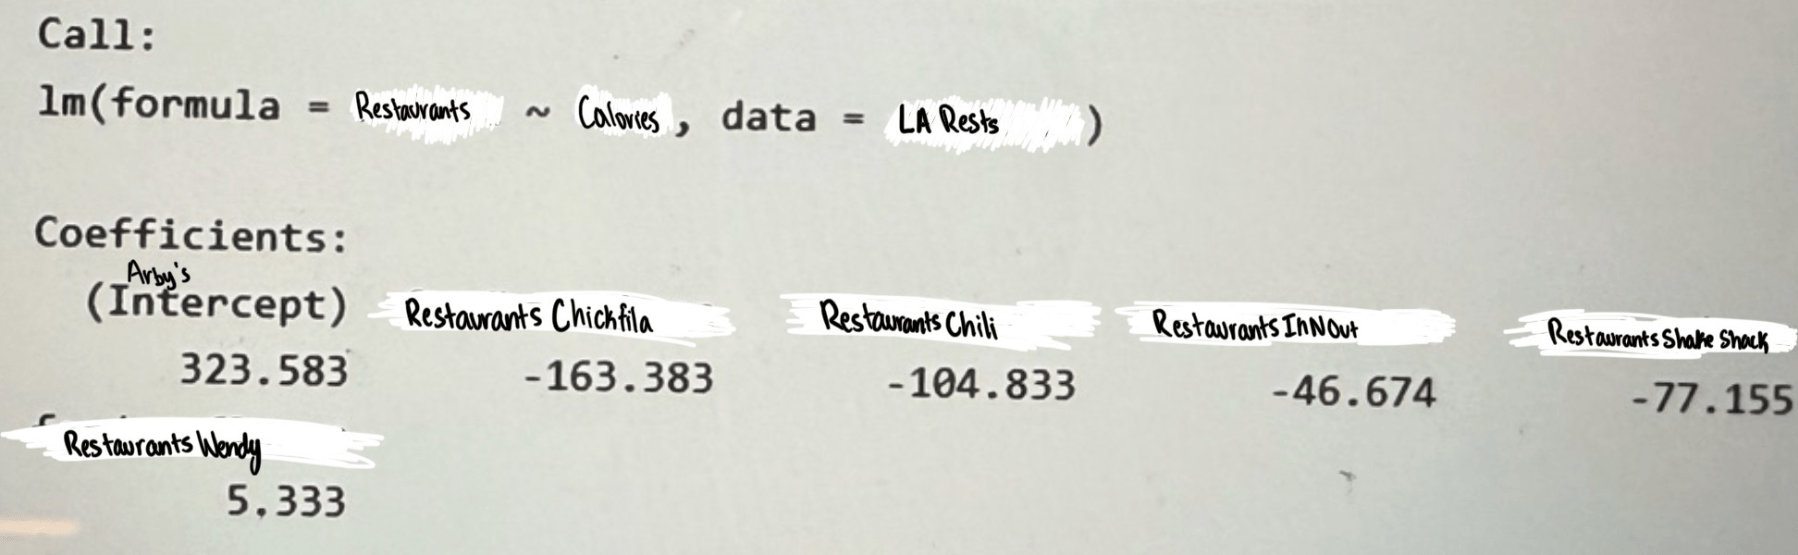 The mean calories for Chickfila, chilis, Wendy’s
What is 160.2, 218.75, 328.91600
600
A researcher wants to know whether the type of study environment affects students test scores using either silence, background music, or noisy cafe. After a week of studying all the students take a test out of 100. What visualization type would you use?
What is faceted histogram, box plot, jitter plot, scatter plot