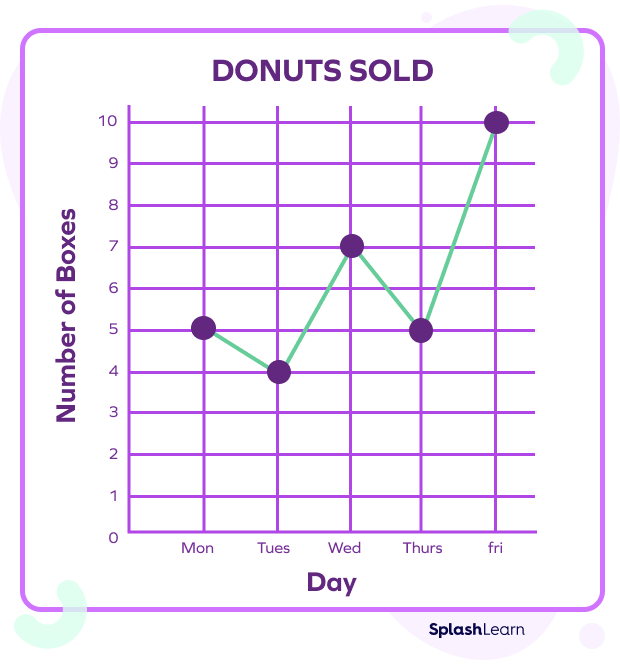
A line graph shows a change over time. Between what two days was there the largest INCREASE in donuts sold?

Thursday to Friday
8 x 3 = ?
24

Pictograph
What color got picked the least?

blue
What is usually found at the top of the graph that tells you what it is about?
a. key b. title c. x-axis
a title
How many more cars were sold on Friday than Thursday?
Each x = 1

4
9 x 5 =
45
How many cupcakes were sold on Tuesday?

15

Bar Graph
What is this part of a graph called?
Key
Which month sold the MOST produce?

June
12 x 5 = ?
60
What did the family spend the MOST money on?

Airplane tickets
How many more students own cats than goldfish?

4 more students
A question asked to several people to get information about one topic is a __________________.
a. survey b. test c. tally mark
survey
What is the graph below?
Line Plot OR Bar Graph

Line plot
9 x 8 =
72
Each picture represents 2. How many sand castles did Carolyn build?

9
What color got picked the most?

green
If 
Then what does half an apple equal? 
 5 apples
What is the graph below?
Line Graph OR Circle graph?

Line Graph
3 x 3 x 6 =
54
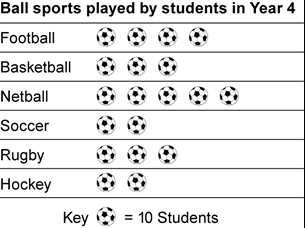
How many students played soccer this year?
*look at the key*

20
How many children picked yellow?

9
Small lines used to count things instead of using numbers are called _________________.
a. tally marks b. pictures c. circles
tally marks