What am I?
What does that mean?
Mean, Median and Mode
Discrete and Continous Data
Qualitative or Quantative
100
What type of graph is this?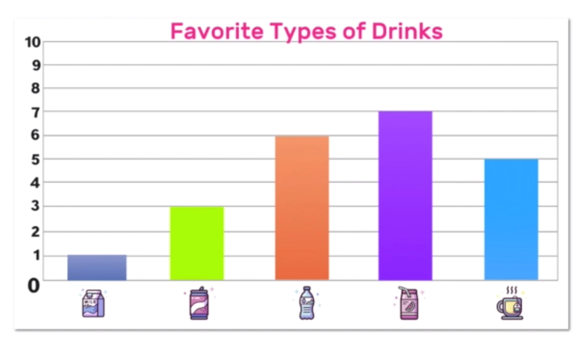
Bar graph
100
How many boys were surveyed? Were more boys asked than girls?
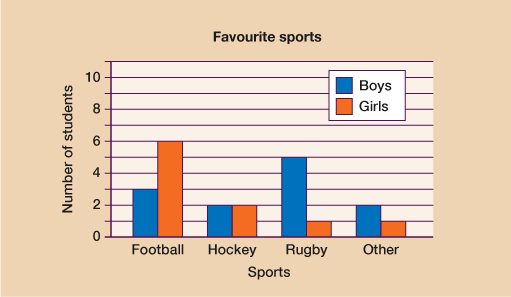
12.
No the same amount of girls and boys were surveyed.
100
What is the mode for this set of numbers:
7, 7, 0, 14, 0, 7, 14
Mode- 7
Step 1: What number appears the most? 7 appears the most so I know 7 is the mode.
100
Items purchased at a grocery store is discrete or continuous data?
Continuous data. You can buy anything at a grocery store!
100
favourite colour is qualitative or quantitive data?
qualitative
200
What type of graph is this?
Double bar graph
200
Hw many students have birthdays in the summer?
7 students
200
What is the mode for this set of numbers:
4,5,7,8,3,3,4,4,8,6,4
Mode- 4
Step 1: What number appears the most? 4 so this is the mode.
200
True or False: Numbers of computers in a school is continuous data? You can count them!
False. It is Discrete Data:
200
sales of a new game are quantitative or qualitative data?
quantitative
300
What type of graph is this?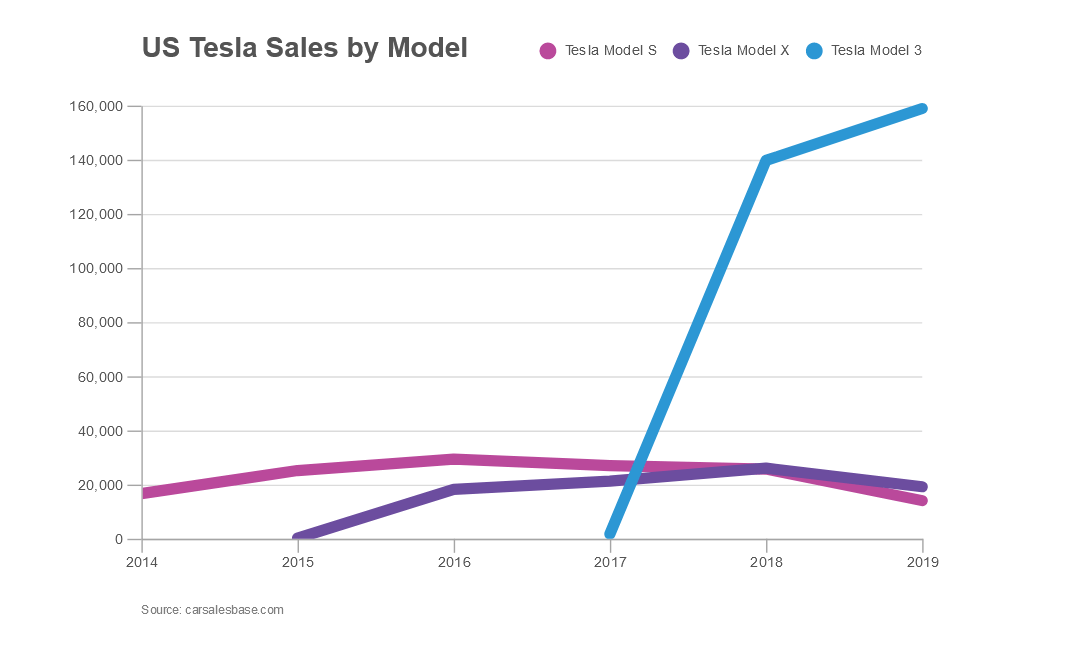
line graph
300
What day of the week were the most muffins sold? The least?
Most: Sunday
least: Monday and Wednesday
300
What is the mean of this set of numbers:
2, 1, 1, 5, 6
Answer: 3
Step 1: Add all numbers together 2+1+1+5+6= 15
Step 2: Divide by how many numbers there are 15 divide by 5=3
300
The average height of 6th-grade students is what kind of data?
continuous data
300
Types of pets are qualitative or quantitative data?
Qualitative: it is a category or type!
400
What type of graph is this and what is it used for?
stacked bar graph. It is used for comparing data. Each bar represents something different.
400
When did the rain the most? Which month was the highest temperature?

October was the month is rained the most.
July was the highest temperature.
400
What is the median for this set of numbers: 3, 4, 9, 7, 7
- Median: 7
Step 1: Place all numbers in order least to greatest 3, 4, 7, 7, 9
Step 2: Find the number in the middle. This number is the median. The middle number is 7 so I know the median is 7.
400
True or False: Continous data is data that can be measured on an infinite scale, It can take any value between two numbers, no matter how small.
True:
Continuous Data can take any value (within a range)
Examples:
- A person's height: could be any value (within the range of human heights), not just certain fixed heights,
400
True or False: The number of students in a classroom and number of rainfalls in a year is a type of qualitative data.
False: This is quantitative data. It can be counted and is numerical.
500
What are scatter plot graphs used for?

shows a pattern
relationship between two sets of data
500
How many ice cream bars were sold altogether from winter, spring, summer, autumn.

$141.00 dollars
500
What is the median for this set of numbers:
3, 12, 18, 12, 7, 12, 6
Median-12
Step 1: Place all numbers in order least to greatest 3, 6, 7, 12, 12, 12, 18
Step 2: Find the number in the middle. This number is the median. Middle number is 12 so I know the median is 12.
500
True or False: Discrete data is data that we can count. For example The number of students in a classroom.
True. Discrete data is data we can count! It has certain values.
500
True or False: Eye colour, type of candy, and favourite movies is a type of qualitative data?
True: Qualitative data is data that can be organized into types of categories.
It is data that can be measured.