Demographic Transition Model (DTM)
Population Growth & Age Structure
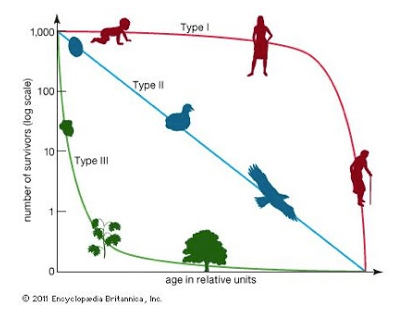
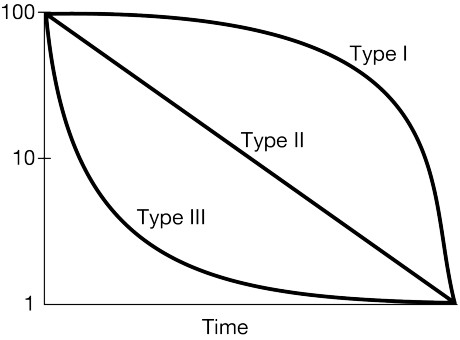
Survivorship Curves
K- & r-Strategists
Human Impacts & Development Levels
100
In Stage 2 of the DTM, what happens to death rates?
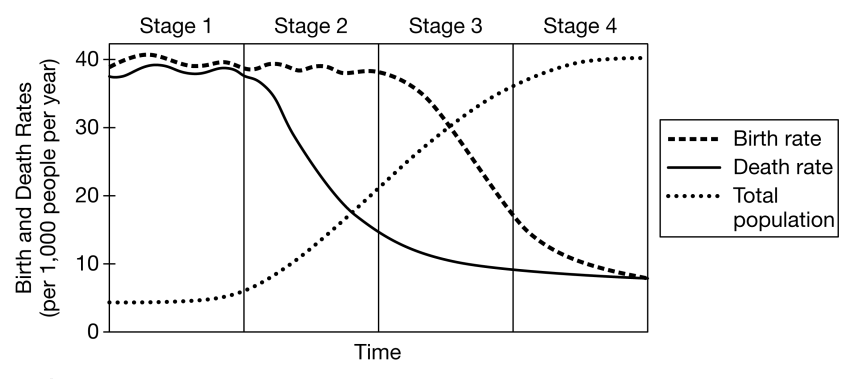
Decrease They fall.
100
What growth pattern corresponds to a J-shaped curve?
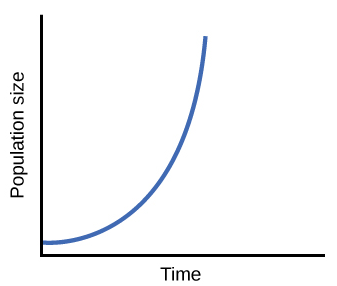
Exponential growth.
100
What survivorship curve do humans typically display?

Type I.
100
A species with few offspring and long parental care is likely what?
A K-strategist with a Type I curve.
100
Why do developed nations have lower fertility rates?
Higher education and healthcare access.
200
What does the DTM describe?

The shift from high birth/death rates to low birth/death rates.
200
Which age structure diagram shape typically shows negative growth?
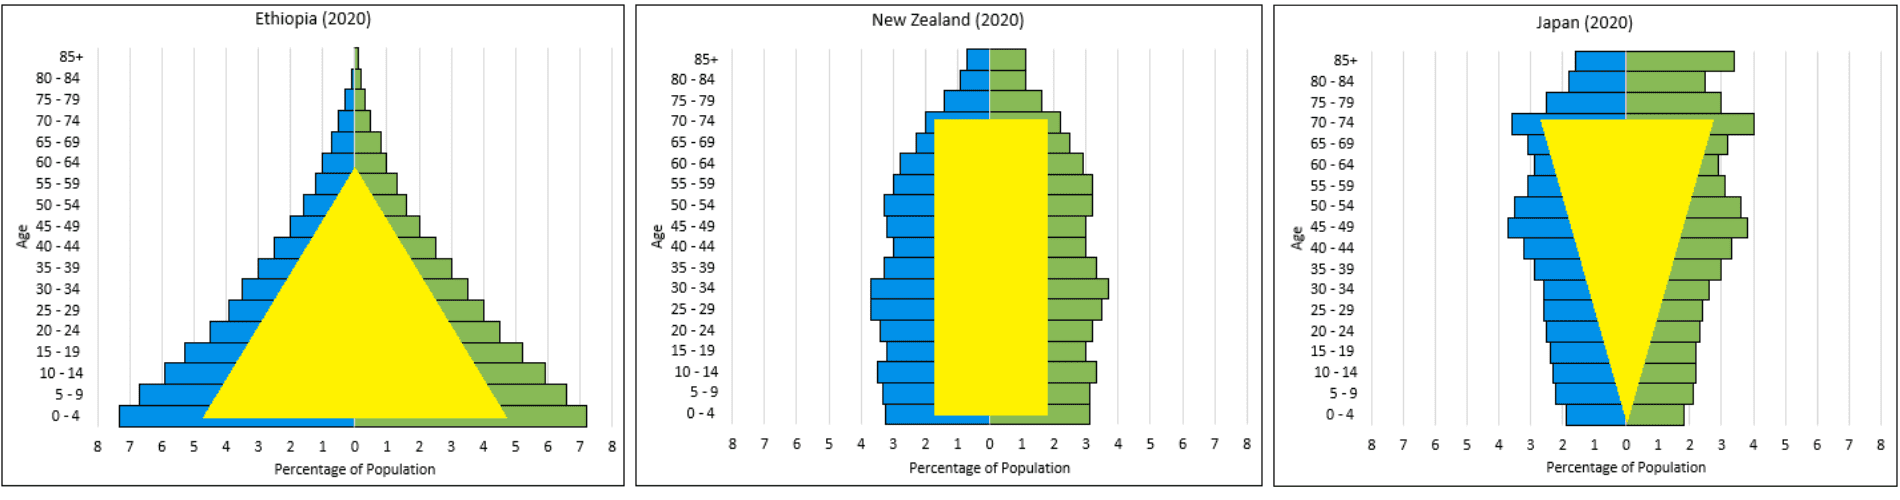
Narrow base compared to upper age groups (inverted pyramid).
200
Which survivorship curve shows high infant mortality?

Type III.
200
Which strategist typically has many offspring and little parental investment?
r-strategist.
200
How does industrialization correlate with environmental impact?
More industrialization usually increases environmental impact.
300
Why do developed countries typically show low birth rates?

Higher education levels and access to healthcare reduce fertility.
300
If a population has many young individuals and few elderly individuals, what future trend is likely?
It will grow rapidly.
300
Why do Type III species produce a large number of offspring?
To compensate for high early-life mortality.
300
Why might an r-strategist thrive after a natural disaster?
Their rapid reproduction helps them recolonize unstable environments.
300
Why do developing nations tend to have higher birth rates?
Limited access to education, healthcare, and family planning.
400
A country just developed new medical technology that reduces infectious disease deaths. How would this likely shift their stage in the DTM?

It would reduce death rates and push the country from Stage 1 → Stage 2.
400
Explain how a country like Japan can have a declining population even with good healthcare.
Low birth rates outweigh the number of people surviving to older ages.
400
Compare Type I and Type II survivorship in terms of parental care.

Type I species invest heavily in parental care; Type II species show constant mortality regardless of parental investment.
400
Describe why K-strategists are more vulnerable to habitat destruction than r-strategists.
They reproduce slowly and cannot quickly recover lost population size.
400
Explain how improved medical technology can shift a developing country’s demographics.
It lowers mortality, leading to rapid population increase.
500
Predict how a developing country’s population structure would change over 30 years if its birth rate remains high but its death rate rapidly declines.

The population would grow rapidly, forming a pyramid-shaped age structure and increasing total population dramatically.
500
Using the concept of carrying capacity, explain why a population might level off after a period of exponential growth.
Resources become limited, shifting the population from exponential to logistic growth.
500
A population of seabirds has constant mortality across all ages. Propose which survivorship curve it fits and justify it using ecological traits.

Type II; these species often face constant predation and environmental hazards across their lifespan.
500
A population of seals begins leveling off as it approaches 7,500 individuals. Explain why this is expected for a K-strategist species.
As resources become limited, growth slows and stabilizes at carrying capacity—typical of K-selected species.
500
A country introduces major healthcare and education reforms. Predict changes in fertility, mortality, and long-term population size.
Fertility and mortality decrease; population growth slows and stabilizes over time.