Line of best fit
Correlations
Outliers and Predictions
Calculating Line of Best Fit
100
Your line of best fit should always been drawn with a straight edge (T/F)
True
100
What type of correlation is this? What would be its correlation coefficient? 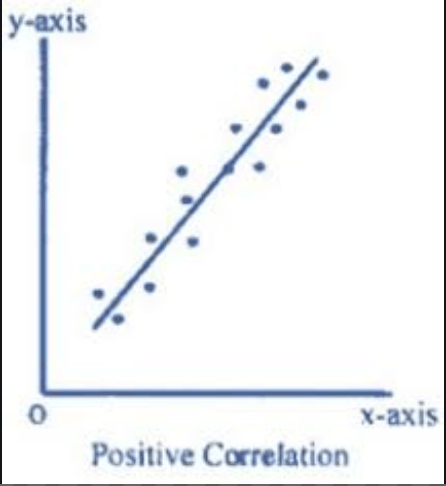
Positive; 0.9
100
When most of the points are close to the line of best fit, but one is very far, this is called an _______________.
Outlier
100
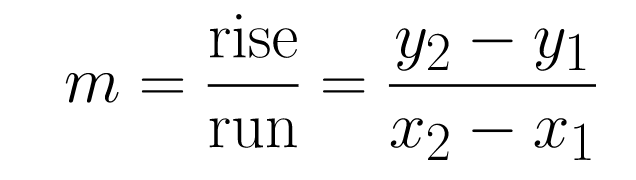
In order to calculate slope, you use....
200
How do you determine where to place the line of best fit?
There should be an equal number of points above and below the line.
200
What type of correlation is this? What would be its correlation coefficient? 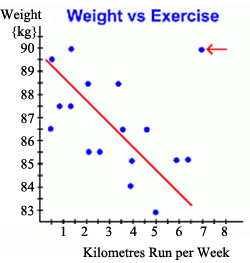
Negative ; -0.5
200
We can make a prediction using...
Line of best fit
200
How do you calculate the equation of a trend line?
1.Draw a line of best fit that splits the data
2. Choose two points on the trend line.
3. Calculate the slope.
4. Calculate the b (y-intercept).
300
What are two points on the line of best fit? 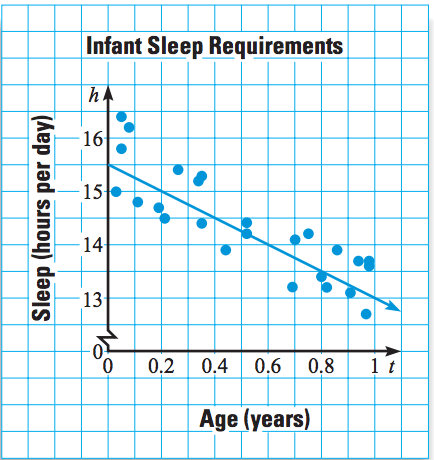
(0.2,15) (0.4,13) (0.6,14) (0.8,12) (1,13)
300
When the values of one data set increases and the other decreases, this is called a ___________ correlation.
Negative
300
What are the coordinates of the outlier in this graph? 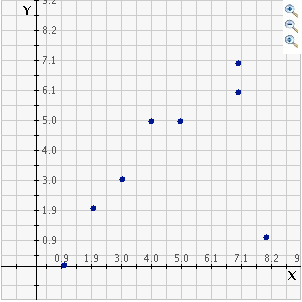
(8.2,0.9)
300
In order to find b you use....
Point-slope form y-y1=m(x-x1)
400
Why do we draw a line of best fit?
To make a prediction beyond the scatter plot
400
When most of the points are very close to the line of best fit, this is called a _______________ correlation.
Strong
400
The equation of the line of best fit is y=-2.12x + 15.5, where x represents the age (in years) of an infant, and y represents the hours of sleep the infant needs. Predict how many hours of sleep an infant who is 6 months (0.5 years) needs.
14.4
400
Two points on the line of best fit are (4, 85) and (2, 70). Find the slope for the line of best fit using these points.
15/2
500
If there is no correlation-is the line positive or negative?
Neither! There is no line!
500
When the points on a scatter plot are scattered in the graph and do not follow a trend, this is called ___________ correlation.
no
500
The equation of the line of best fit for a scatter plot is y=12x - 216, where x represents the temperature outside and y represents the sales of the ice cream shop. Predict the temperature outside if the ice cream shop had a total sales of $700.
76.33
500
Find the equation of the line of best fit 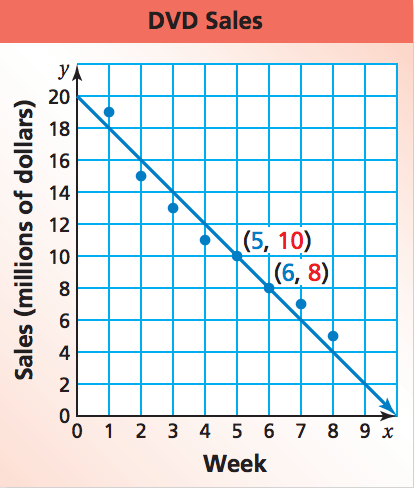
y=-2x+20