Measures of Centre
Measures of Spread
Bias & Errors
Geography
100
Mean, median or mode: which one would we use for summarising data about peoples' favourite colours?
Mode--can't do mean or median for this data!
100
What is the range of the following stem and leaf plot?

43 - 7 = 36
100
Which of the following sampling methods will result in the least reliable/valid data?
A) Random
B) Self-selected
C) Stratified
D) Systematic
B) Self-selected
100
With an area of only 0.5 km2, what is the smallest country in the world?
Hint: It is also a city.
The Vatican City
200
For his upcoming concert, Kendrick Lamar is selling:
1000 mosh pit tickets for $100 each
2000 seated tickets for $80 each
5 exclusive back stage passes for $10,000 each
Pete says that tickets to the concert "are about $100."
Paul says "no, they're actually only $80."
Whose estimate is more accurate, and why?
Paul is using median, Pete is using mean.
Median is better here, because of the outliers.
200
The following data values are the number of points scored by basketball team over their last 20 games:
46, 48, 43, 27, 2, 10, 44, 45, 27, 37, 49, 40, 12, 35, 44, 37, 4, 9, 26, 11
If you were making a grouped frequency table that starts at 0 with interval widths of 10, what would the frequency be for the interval 30-?
3 - 35, 37 and 37 are in this interval
200
Identify the main issue with this graph:
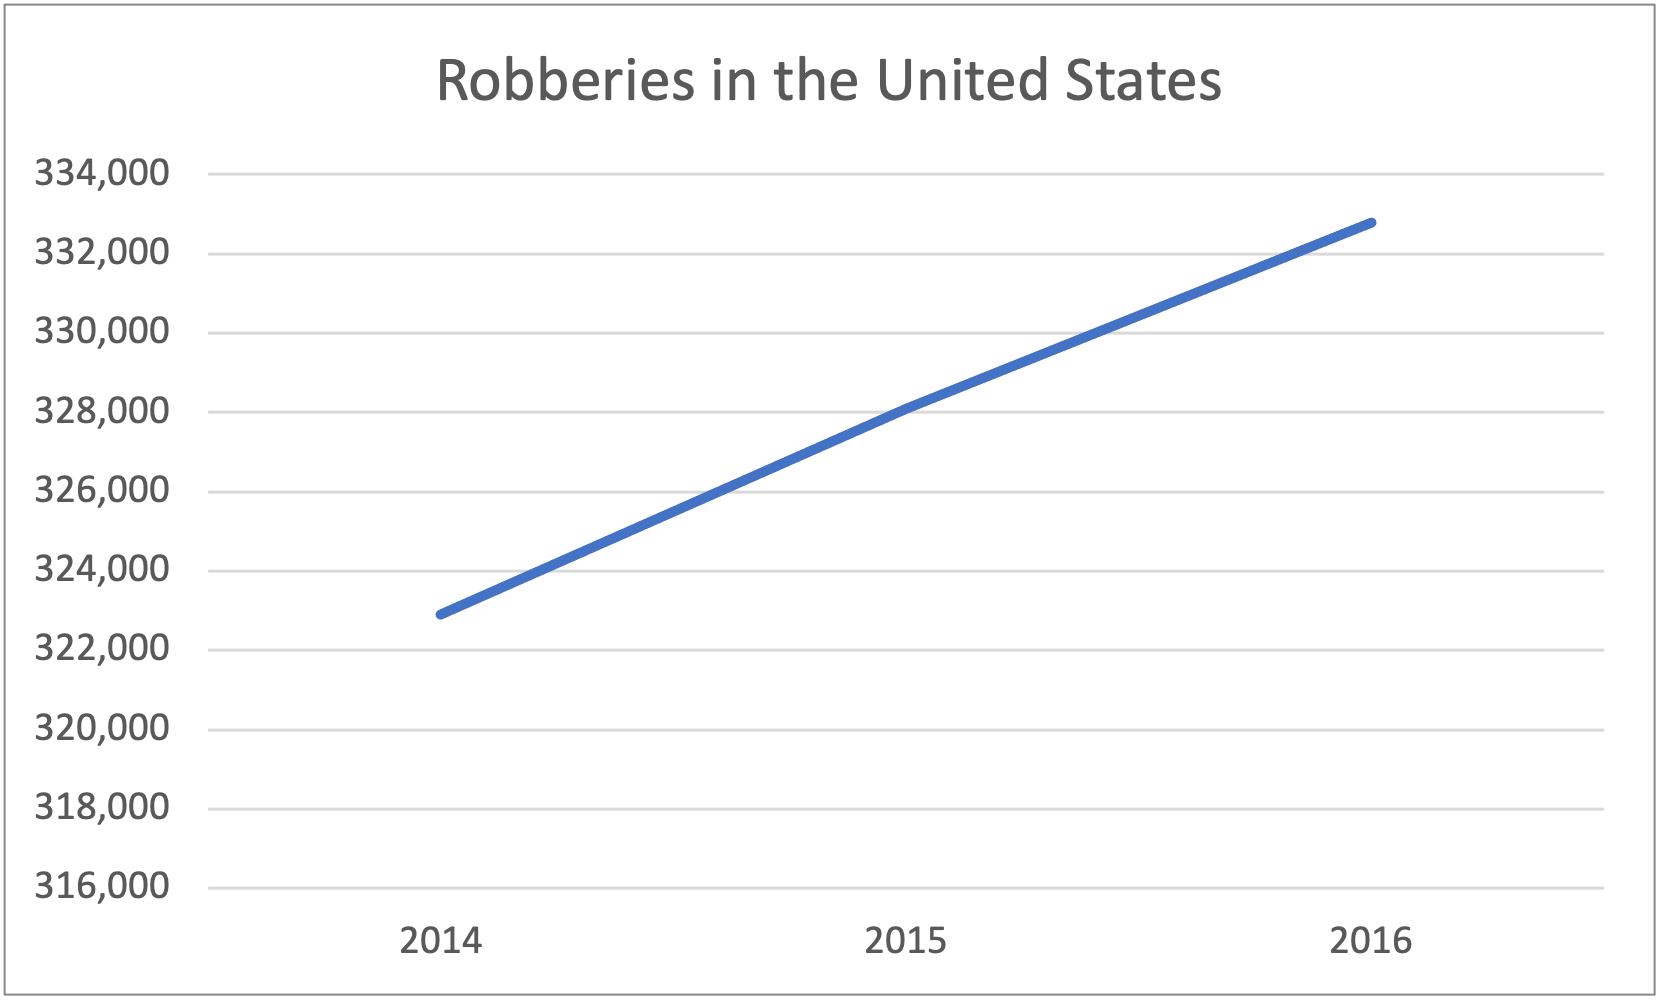
Y axis scale much too small/doesn't start at 0
200
The area sometimes referred to as the 'Middle East' includes countries and regions from which two continents?
Asia and Africa
300
Q2 of a data display is commonly referred to as the __________, and ______ of the values in the data set will be higher than it.
median
50%
300
For the following stem and leaf plot, what is Q3?

30
300
Rank the following options from least to most reliable, in terms of the data they collect:
- Census
- Random sampling
- Self-selected sampling
- Stratified sampling
Self-selected < Random < Stratified < Census
300
Identify each of the three flags below, to earn the corresponding amount of points:
100 points 300 points 500 points


1) Italy
2) Hungary
3) Bulgaria
400
Describe the shape and centre of this stem and leaf plot showing the ages of 47 people
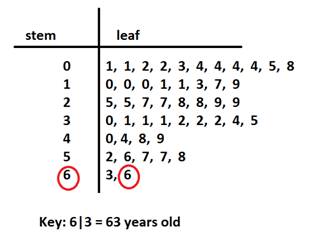
Shape: positively skewed
Centre: Median is 28 years old/median interval is 20-29 years old
400
Data Set A has a mean of 14.3 and a standard deviation 1.79.
Data Set B has a mean of 15.7 and a standard deviation of 2.09.
Which statement is true?
A) The data in Set A is more variable than Set B.
B) The data in Set A has outliers.
C) The average of Set B is lower than Set A.
D) The average and variability of Set A is lower than Set B.
D) The average and variability of Set A is lower than Set B.
400
Identify the main issue with this graph, which seems to prove that global warming is not occurring.

Y-axis scale much too large
400
Azerbaijan is one of only three countries in the world whose name features an 'az' letter sequence.
Name either of the other two countries whose names feature this letter sequence (anywhere in their name)
Brazil
Kazakhstan